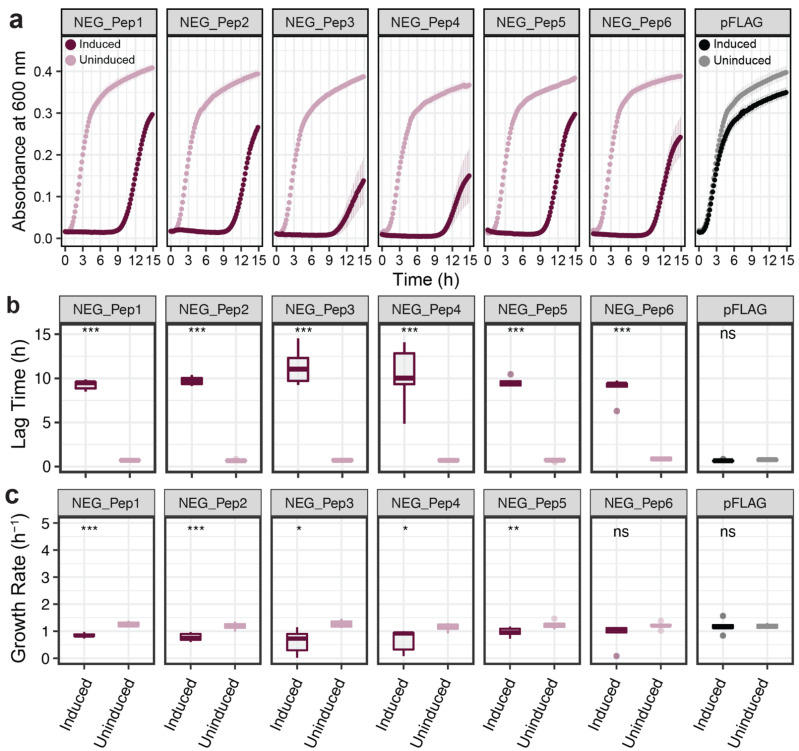
Figure 2.
Growth rate comparisons for NEG_Pep clones compared to empty vector. (a) Growth curves without IPTG induction are depicted as light colors and with IPTG induction are in dark colors. OD600 was recorded every 10 min with at least five replicates for each clone and condition. Dots represent means and whiskers, showing the standard error of the mean (SEM) across replicates. (b) Lag time comparisons between the six clones, measured as the time from the start of the experiment until the start of the exponential growth. (c) Growth rate comparisons between the six clones after the end of the lag phase. Boxplots show medians with lower and upper hinges corresponding to the 1st and 3rd quartiles. Student’s t-test was performed with p-values as follows: *** = p < 0.001, ** = p < 0.01, * = p < 0.05, ns = p > 0.05.

