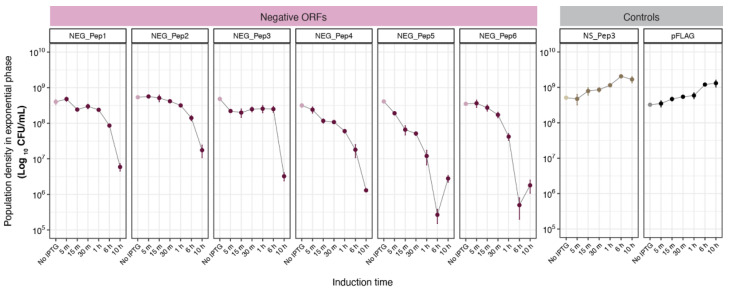
Figure 3.
Test for the viability of cells after NEG_Pep induction. Colony counts (CFU/mL) of bacteria in the log phase, expressing either negative, non-significant or pFLAG peptides at different times after IPTG addition, show a decline in the NEG_Pep strains. Growth of the NS_Pep and pFLAG controls, on the other hand, is not affected by IPTG induction. Each panel’s light color dots represent growth under no induction, followed by IPTG addition (darker dots). Three replicates were done for each time point; whiskers in each dot represent SD.

