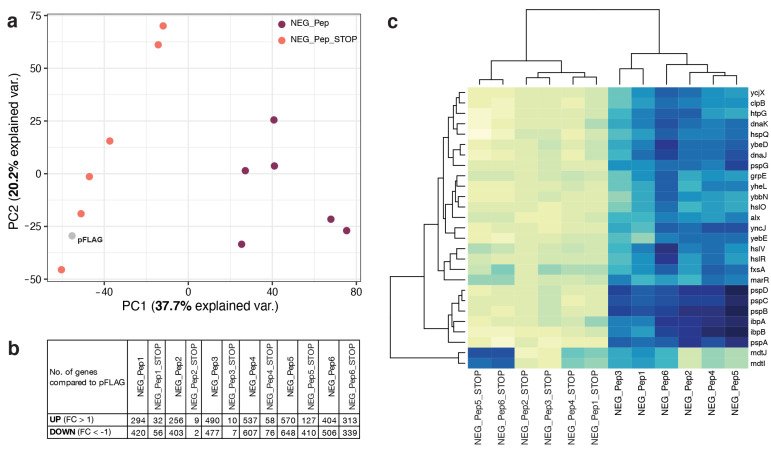
Figure 4.
Transcriptomes of host cells expressing NEG_Pep clones show differential up-regulation of genes compared to their stop codon versions. (a) Principal component analysis (PCA); dots represent average expression from three replicates for each sample. (b) Numbers of genes above and below log2 fold change (FC) of 1 and −1 are shown here respectively. (c) Top highly expressed genes in all NEG_Peps are represented in the heatmap with dendrograms highlighting the differential expression in their corresponding stop codon versions. The x-axis shows the sample names and y-axis lists the top expressed genes (log2 FC > 4) from the expression analysis.

