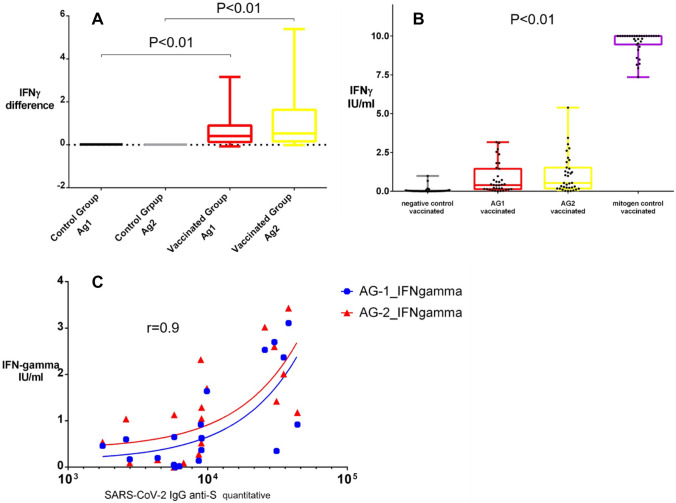
Fig. 2.
Differences in SARS-CoV-2-specific IFNγ levels between the native control group compared to the vaccinated group for both Ag1 and Ag2 tubes of the QuantiFERON SARS-CoV-2 RUO test (A); Scatter plots demonstrating the IFNγ levels in the negative control tube, Ag1 tube, Ag2 tube, and the mitogenic Contol tube for all vaccinated subjects enrolled in the study(B); Scatter plot displaying the correlation between antibodies and IFNγ differences measured by the QuantiFERON SARS-CoV-2 RUO test (C)

