Fig 1.

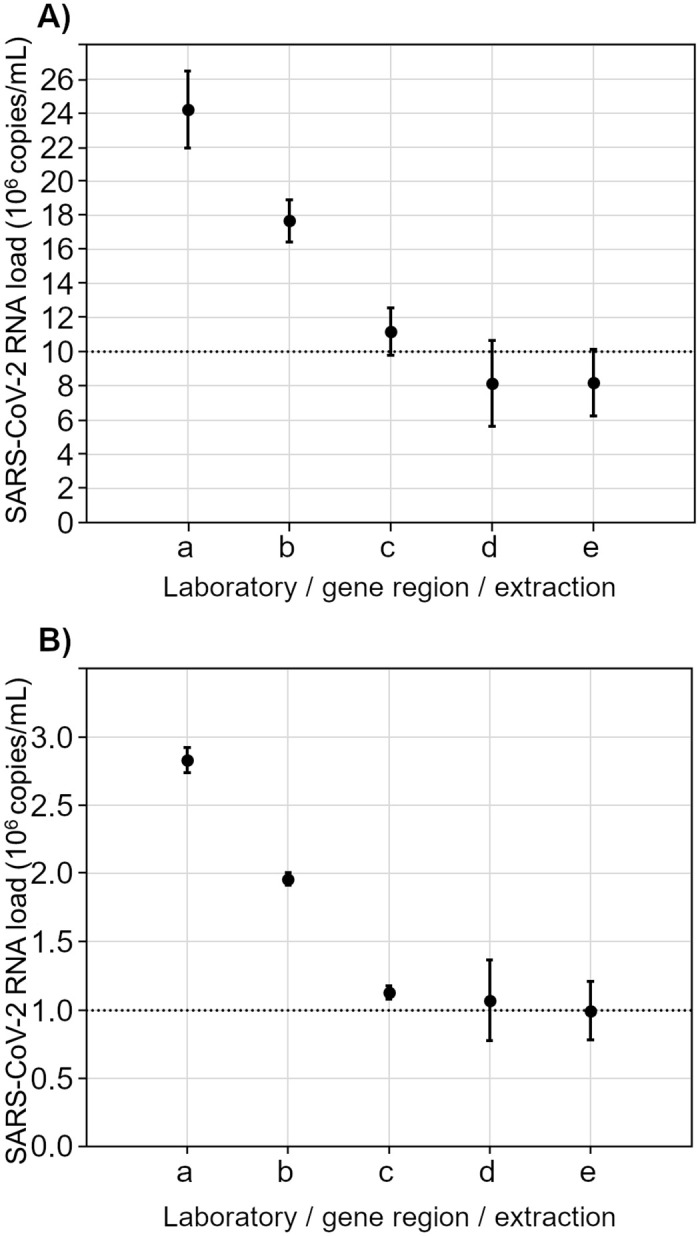
RT-PCR measurement results with 95% confidence intervals on the basis of quantification with synthetic RNA by laboratory 1 and laboratory 3 for RM 1 (A) and RM 2 (B) with details on extraction, amplification and target gene. a = laboratory 1/extraction: Qiagen QIAamp Viral RNA Mini Kit/amplification: in-house/gene region: E gene b = laboratory 1/extraction: Roche MagNA Pure 96 Viral NA Small Volume Kit/amplification: in-house/gene region: E gene c = laboratory 3/extraction: Qiagen QIAamp Viral RNA Mini Kit/amplification: in-house/gene region: E gene d = laboratory 1/extraction: Qiagen QIAamp Viral RNA Mini Kit/amplification: in-house/gene region: RdRP gene e = laboratory 1/extraction: Roche MagNA Pure 96 Viral NA Small Volume Kit/amplification: in-house/gene region: RdRP gene The dotted line in (A) represents the expected SARS-CoV-2 RNA loads of 107 copies/ml for RM 1. The dotted line in (B) represents the expected SARS-CoV-2 RNA loads of 106 copies/ml for RM 2.
