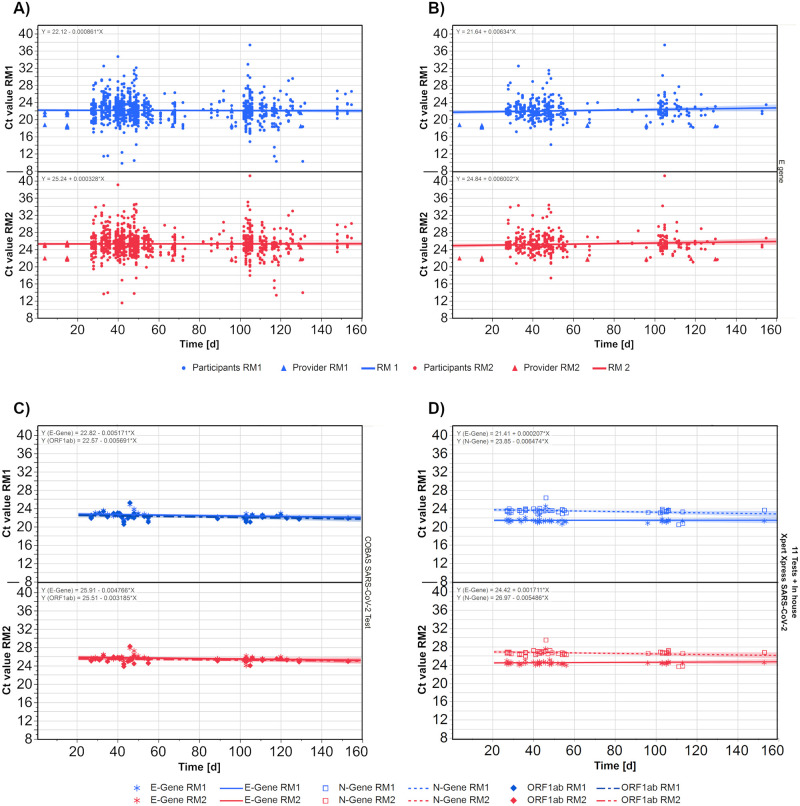
Fig 3.
Development of Ct values for both reference samples over time for all results (A), just for E gene results (B), as well as all results the test system Cobas (C) and test system XpertXpress (D) for their respective gene targets. Each symbol represents one measurement. The lines represent the regression lines for the corresponding data set and the formular is displayed in the upper right corner. Dots are participants results and triangles are results from the sample provider (Figure A and B). For Figure C and D no provider results were present, so we used the asterisk for e gene result, the square for N gene results and the diamond for ORF1ab results.

