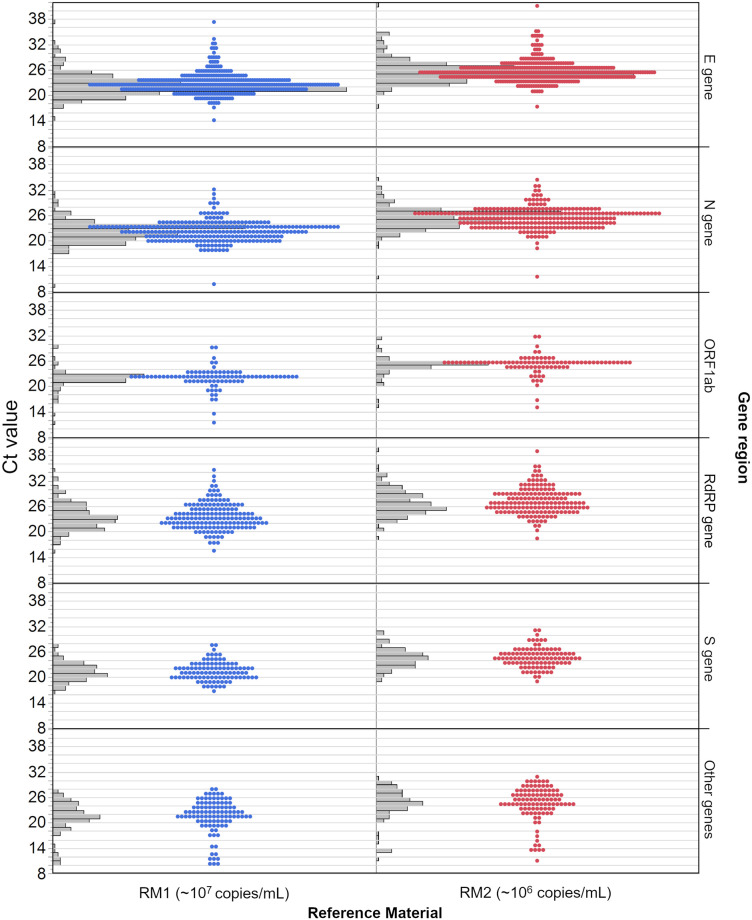
Fig 4. Distribution of all Ct values of participants per gene region.
The concentration of RM 1 (blue) is estimated at roughly 107 copies/mL and the concentration of RM 2 (red) is estimated at roughly 106 copies/mL. Grey bars represent the distribution of results, which is also represented by the dots. Each dot indicates one result.

