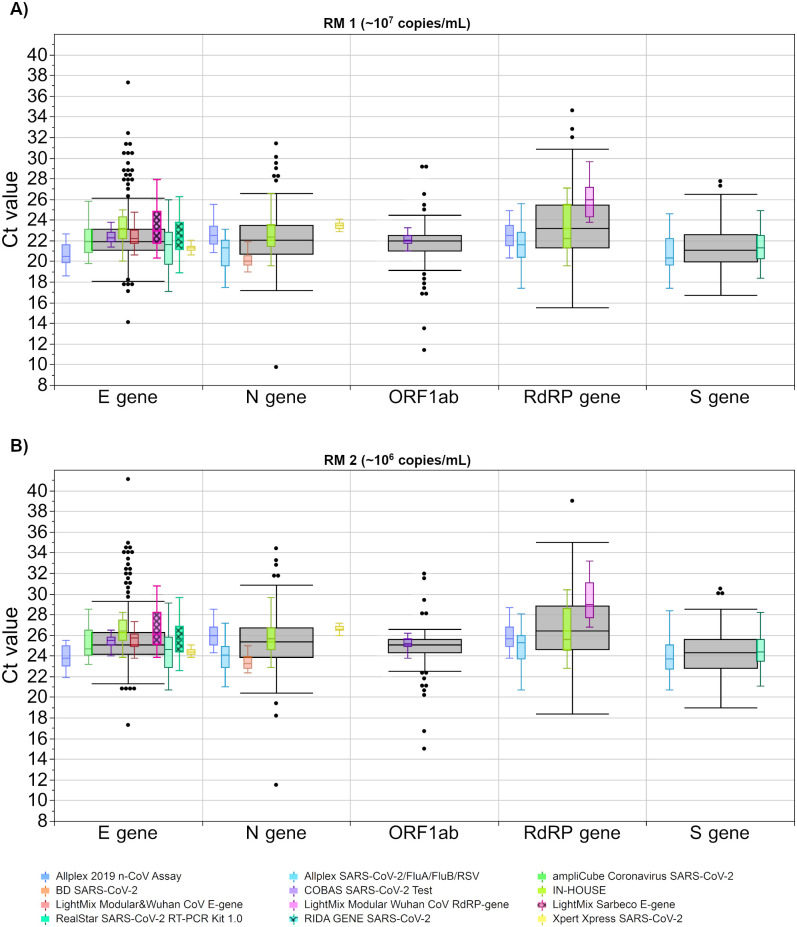
Fig 6. Analysis of Ct values for both samples for different test systems.
The concentration of RM 1 (A) is estimated with at 107 copies/mL and the concentration of RM 2 (B) is estimated with at 106 copies/mL. The black boxes display all results for the respective sample, and the distributions of specific manufacturer-based collectives are illustrated as smaller, colored box plots in overlay with the total results. Outlier were excluded from colored boxes. Collectives are shown for eleven test kits. For all boxes, the whiskers stretch from the 1st quartile—1.5*(interquartile range) to the 3rd quartile + 1.5*(interquartile range).

