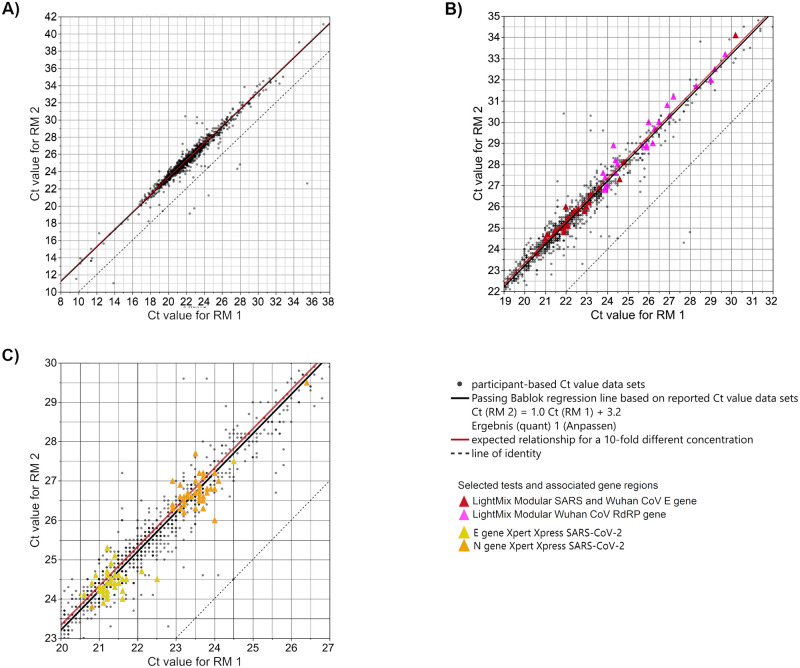
Fig 9.
Analysis of participant-based Ct value correlation of both samples (A) with highlighted LightMix test systems (B) and Xpert Xpress test system (C). The concentration of RM 1 is estimated at roughly 107 copies/mL and the concentration of RM 2 is estimated at roughly 106 copies/mL. The results of all laboratories are plotted for both samples and corresponding Passing Bablok regression is shown (black regression line Ct (RM 2) = 1.0 Ct (RM 1) + 3.2), corresponding 95%-confidence limits are narrow and cannot be distinguished from the Passing Bablok regression line. Grey dashed line: line of identity. Exemplary test kits are highlighted with colour. The red line marks the expected relationship of Ct values for the two samples with concentration differences of a power of ten: Ct (RM 2) = 1.0 Ct (RM 1) + 3.32.

