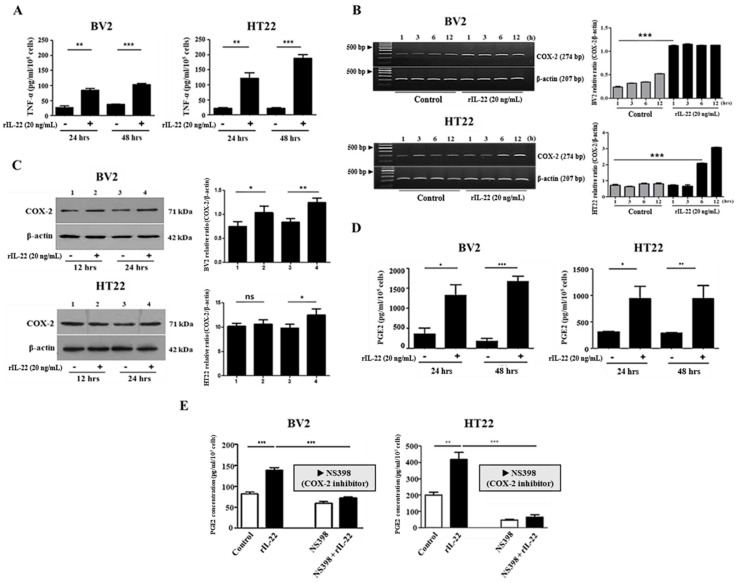
Figure 2.
The interaction between IL-22 and IL-22Rα induces pro-inflammatory cytokine production in BV2 and HT22 cells. (A) ELISA-based analysis of TNF-α in the supernatants of BV2 and HT22 cells treated with or without IL-22 (20 ng/mL) for 24 or 48 h. ** p < 0.01; *** p < 0.001. (B) RT-PCR analysis of COX-2 expression in BV2 and HT22 cells treated with or without IL-22 (20 ng/mL) for 1, 3, 6, or 12 h. Relative intensity was analyzed by ImageJ software. All results were representative of at least three independent experiments. Values were presented as the mean ± SD. Significance (p-value) was determined by t-test, *** p < 0.001. (C) Western blot analysis of COX-2 expression in BV2 and HT22 cells treated with or without IL-22 (20 ng/mL) for 12 or 24 h. Relative intensity was analyzed by ImageJ software. * p < 0.05; ** p < 0.01; ns, not significant. (D) ELISA-based analysis of PGE2 in the supernatants of BV2 and HT22 cells treated with or without IL-22 (20 ng/mL) for 24 or 48 h. * p < 0.05; ** p < 0.01; *** p < 0.001. (E) ELISA-based analysis of PGE2 in the supernatants of BV2 and HT22 cells treated with or without IL-22 (20 ng/mL) and/or NS-398 (40 μM) for 24 h. ** p < 0.01; *** p < 0.001.

