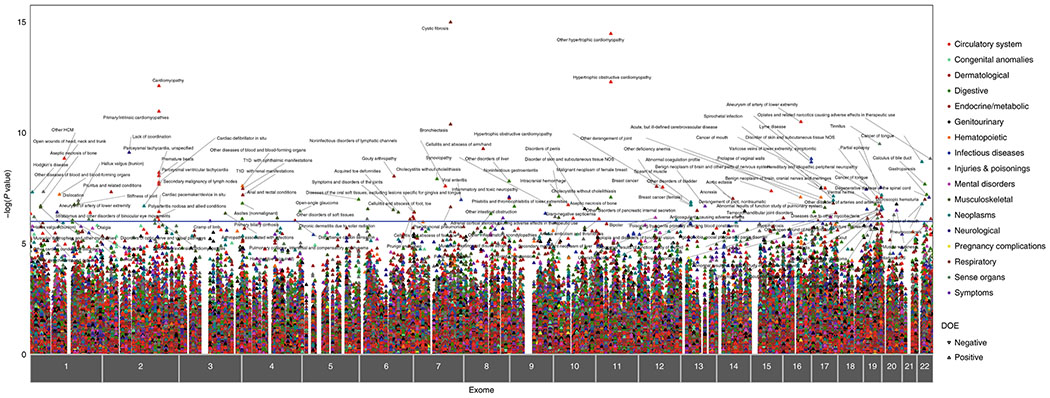
Figure 2. ExoPheWAS plot exhibits the landscape of gene-phenotype associations across the exome and phenome in the Penn Medicine Biobank.

Plot of the results of the exome-by-phenome-wide association study (ExoPheWAS) in the Penn Medicine Biobank for 1518 gene burdens of rare (MAF ≤ 0.1%) predicted loss-of-function (pLOF) variants. The x-axis represents the exome and is organized by chromosomal location. The location of each gene along the x-axis is according to the gene’s genomic location per Genome Reference Consortium Human Build 37 (GRCh37). The association of each gene burden with a set of 1,000 phecodes is plotted vertically above each gene, with the height of each point representing the −log10(p value) of the association between the gene burden and phecode using a logistic regression model. Each phecode point is color-coded according to the phecode group, and the directionality of each triangular point represents the direction of effect (DOE). The blue line represents the significance threshold at p=E-06 to account for multiple hypothesis testing.
