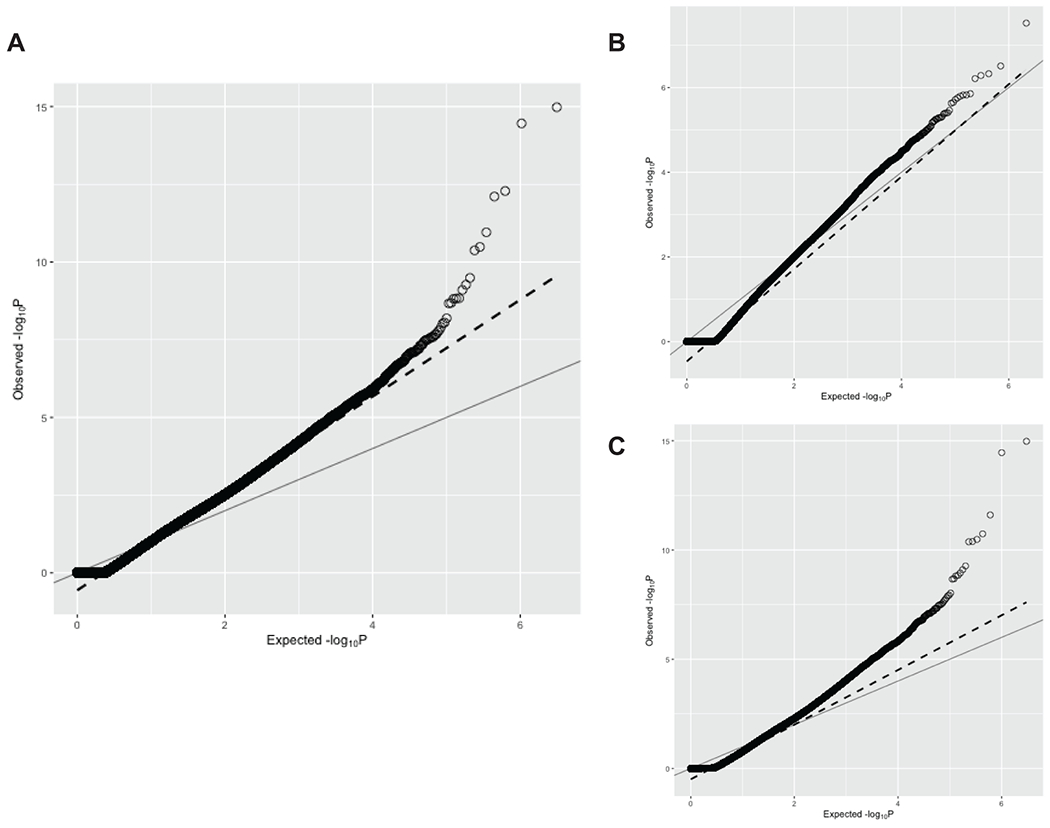
Extended Data Fig. 3. Quantile-quantile plot of gene burden testing results from discovery phase of exome-by-phenome-wide association studies in Penn Medicine Biobank.

A) Quantile-quantile plot of p values from all exome-by-phenome-wide associations using gene burdens collapsing rare (MAF ≤ 0.1%) predicted loss-of-function (pLOF) variants per gene in the Penn Medicine Biobank (PMBB). The x-axis represents the expected −log10(p value) under the uniform distribution of p values. The y-axis represents the observed −log10(p value) from the discovery phase of the exome-by-phenome-wide gene burden association studies collapsing rare pLOF variants in PMBB. Each point represents an association between one of 1518 gene burdens and one of 1000 phecodes via logistic regression. The solid line shows the relationship between the expected and observed p values under the uniform p value distribution. The dashed line represents the observed fit line between the 50th and 95th percentile of gene burden associations, and the slope of this line is λ∆95 = 1.558. B) AFR-specific QQ plot of p values from all exome-by-phenome-wide associations using gene burdens collapsing rare (MAF ≤ 0.1%) predicted loss-of-function (pLOF) variants per gene in PMBB. Data is presented in a similar manner to panel A. The slope of the fitted line is the AFR-specific λ∆95 = 1.09. C) EUR-specific QQ plot of p values from all exome-by-phenome-wide associations using gene burdens collapsing rare (MAF ≤ 0.1%) predicted loss-of-function (pLOF) variants per gene in PMBB. Data is presented in a similar manner to panel A. The slope of the fitted line is the EUR-specific λ∆95 = 1.251.
