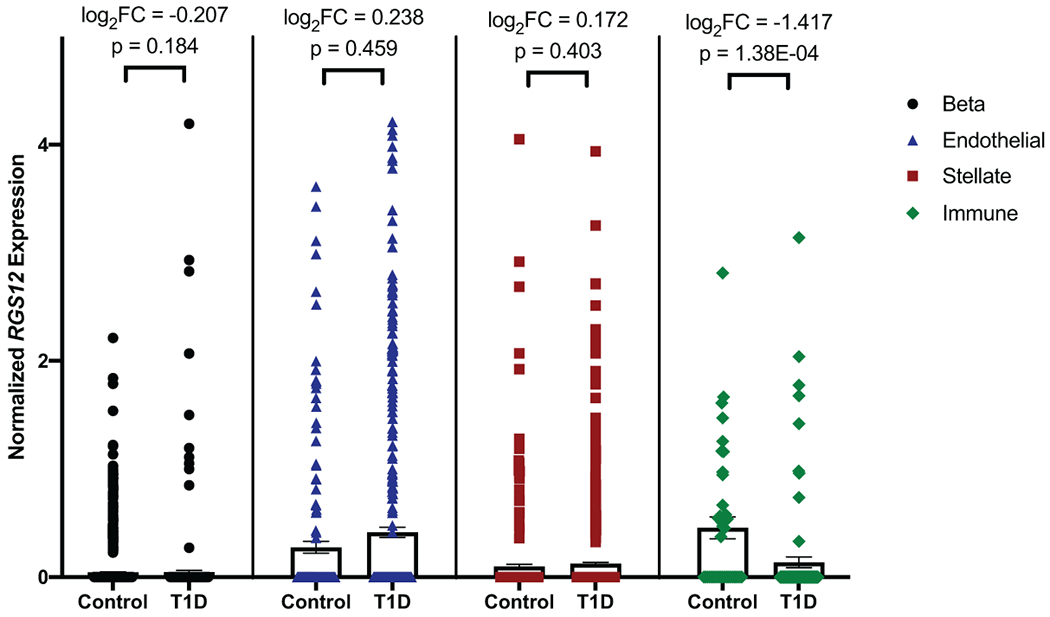
Extended Data Fig. 6. Single-cell RNA-seq of human pancreatic cells shows that RGS12 is not differentially expressed in pancreatic exocrine and endocrine cells, but is reduced in type 1 diabetic peri-islet macrophages.

Comparison of RGS12 expression levels in type 1 diabetes (T1D) versus control in pancreatic beta (endocrine; N=2 T1D donors (410 cells), N=6 control donors (1573 cells)), endothelial (N=5 T1D donors (441 cells), N=6 control donors (166 cells)), stellate (exocrine; N=5 T1D donors (910 cells), N=6 control donors (356 cells)), and peri-islet immune (CD45+ macrophages; N=5 T1D donors (95 cells), N=4 control donors (40 cells)) cells based on single-cell RNA-seq. Differential expression of RGS12 in each cell type was determined by edgeR, which fits normalized expression data to a negative binomial model and uses an exact test with false discovery rate (FDR) control to determine differential expressed genes. Data is presented as bars representing mean normalized RGS12 expression and error bars representing standard error of the mean (SEM). Individual points are plotted overlaying their respective bar plots. Differential expression as determined by edgeR are displayed for each cell type as log2 fold change and p values adjusted by FDR correction.
