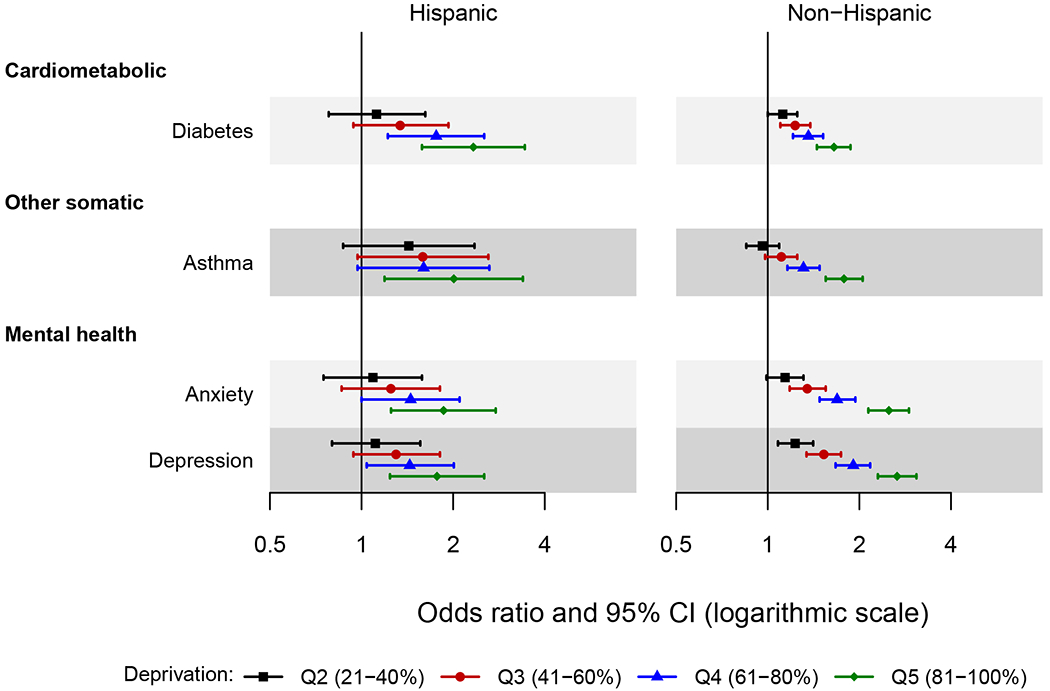
Figure 4.

Forest plot showing the odds ratio and 95% confidence interval of chronic conditions across quintiles of area deprivation index (ADI) by ethnicity.
The area deprivation index was estimated at the census block group level. Quintiles were defined using national area deprivation index rankings from the Neighborhood Atlas (https://www.neighborhoodatlas.medicine.wisc.edu/). Quintile 1 (1-20%) served as the reference.
Only the chronic conditions for which the two-way interactions of area deprivation index by ethnicity reached statistical significance are presented in the figure (4 chronic conditions). Odds ratios were adjusted for age, sex, race, and individual level of education.
CI, confidence interval.
