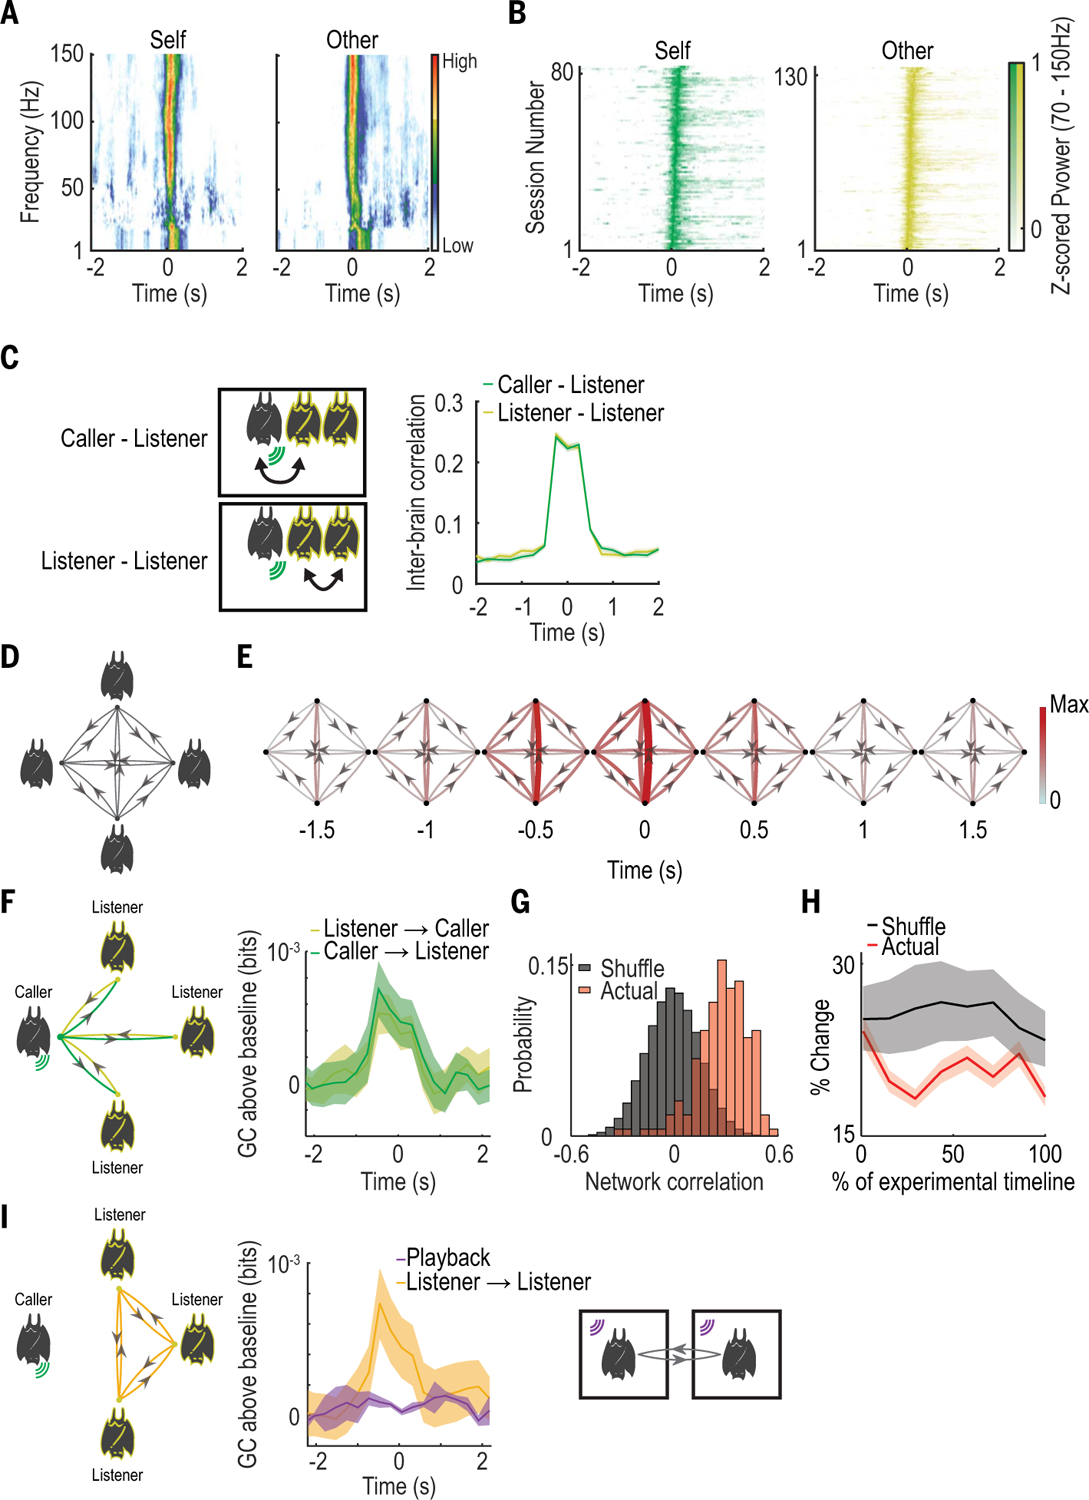
Fig. 2. Group interbrain activity patterns around social vocalizations produced during free group vocal interactions.

(A) Example average LFP spectrograms (normalized at each frequency bin) from one bat during one session. (B) Average power of high-frequency LFP (70 to 150 Hz) for all sessions, displayed as in (A). (C) Left: Schematics of interbrain correlation between bat pairs involving the calling bat (top) and involving only listening bats (bottom). Right: Call-aligned interbrain Pearson correlation of high-frequency (70 to 150 Hz) LFP power averaged across all vocalizations and bat pairs. Throughout this figure, shaded areas denote SEM. (D) Schematic illustrating all possible connections in a group of four bats. Nodes indicate bats, edges indicate interbrain relationships, and arrows indicate directionality. (E) Group interbrain GC graphs using all vocalizations (both calling and listening), calculated using a sliding window of 1-s duration around call onset. GC magnitudes are represented by both color and line width. (F) Left: Illustration of the different directional relationships that exist when a given bat is vocalizing. Right: Baseline-subtracted GC values aligned to call onset, calculated separately for vocalizations from each bat and averaged across bats. Data are shown according to the relationships delineated in the diagram at left (colors). (G) Distribution of average correlation values between GC magnitudes calculated using vocalizations equally binned across all experimental days (red) compared to shuffled data (gray). High values indicate similarity over time. Actual values are significantly higher than shuffled (P = 0.03, Mantel test). (H) Bin-to-bin percent change in GC values over the duration of the experiment, presented as percentage of experimental timeline and compared to shuffled values for the same bins. (I) Left: Illustration of listener-to-listener relationships in the group setting. Right: Simultaneous playback experiment. Center: Average baseline-subtracted GC values during playback compared to listener-to-listener GC values during free communication.
