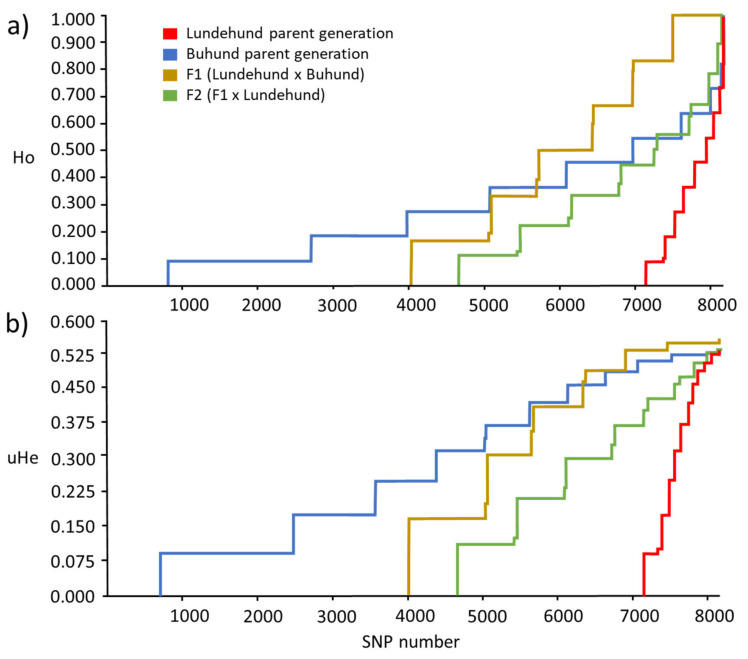
Figure 2.
Cumulative curves of the observed heterozygosity (Ho) (a) and unbiased expected heterozygosity (uHE) (b) estimated from 8184 loci of the 4 dog groups: Lundehund, Buhund, first-generation crosses F1 (Lundehund × Buhund) and first-generation backcrosses F2 (F1 × Lundehund). The lines show a decline in the number of loci with a certain range of Ho and uHe (the lengths of the horizontal lines) per generation. In the parental generation, the Buhund has the longest horizontal lines followed by the F1 generation, the F2 generation and, finally, the Lundehund.

