Figure 7.
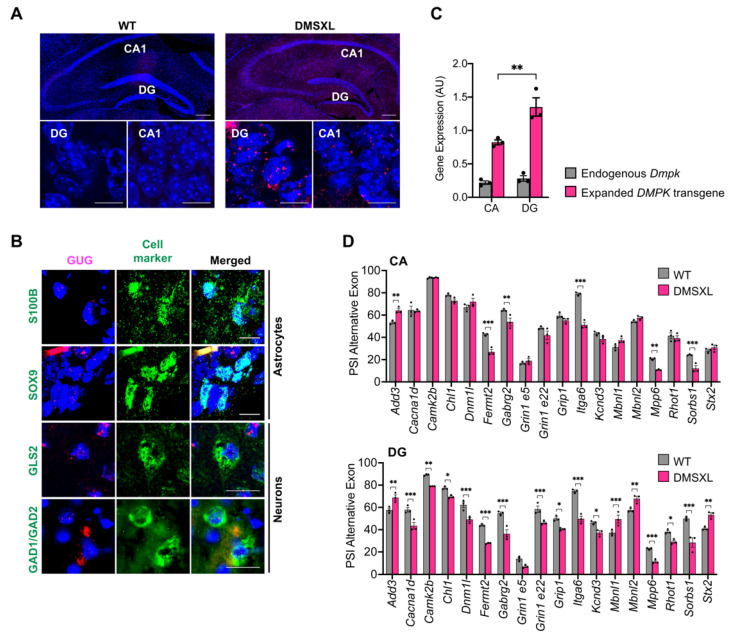
RNA foci accumulation and spliceopathy in the DMSXL hippocampus. (A) FISH analysis of nuclear foci accumulation in the hippocampus of WT and DMSXL mice. The DMSXL hippocampus shows greater foci content in DG compared with CA1 at 1 month of age. Scale bar a lower magnification, 200 µm. Scale bar a higher magnification, 50 µM. (B) FISH of RNA foci (magenta) combined with IF detection of astrocyte (S100B or SOX9), glutamatergic (GLS2), and GABAergic (GAD1/GAD2) protein markers (green). Nuclei were stained with DAPI (blue). Scale bar, 10 µm. (C) Expression of human DMPK transgene and mouse endogenous Dmpk gene relative to Polr2a internal control in CA and DG areas of the DMSXL hippocampus at 1 month of age. ** p = 0.0022. (D) Splicing dysregulation in the CA and DG areas of the DMSXL hippocampus at 1 month of age (n = 3 mice per genotype). The graphs represent the PSI (percentage of splicing inclusion) of alternative exons. * p < 0.05, ** p < 0.001, *** p < 0.001 (two-way ANOVA, Sidak post hoc test for multiple comparisons).

