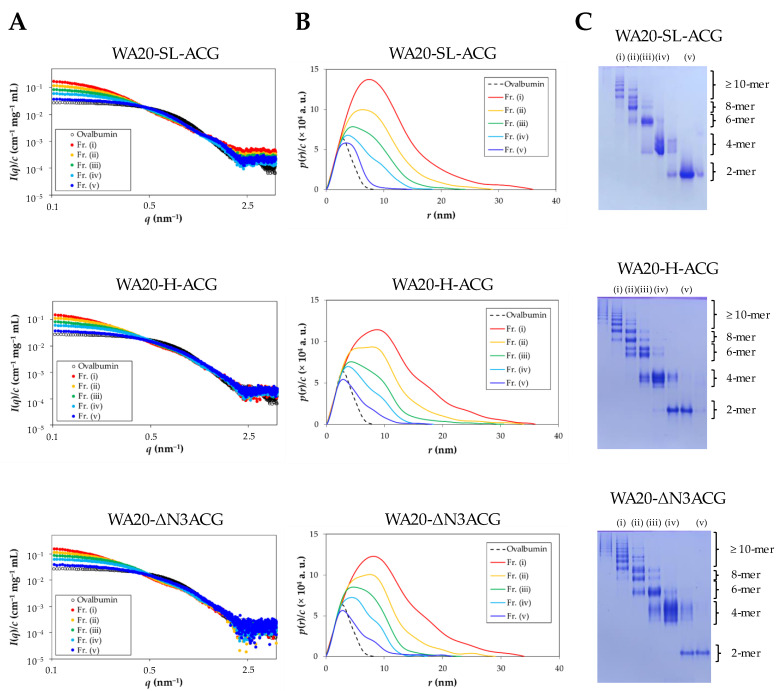
Figure 3.
SAXS analysis. (A) Concentration-normalized absolute scattering intensities of the fractionated samples (Fr.) of WA20-SL-ACG, WA20-H-ACG, and WA20-ΔN3ACG. Ovalbumin was used as a reference standard of the molecular mass. (B) Concentration-normalized pair-distance distribution functions of WA20-SL-ACG, WA20-H-ACG, and WA20-ΔN3ACG obtained by inverse Fourier transforming the SAXS data. (C) Native PAGE analysis of the samples fractionated by SEC purification for the SAXS experiments. Proteins were stained with Coomassie brilliant blue. The oligomeric states of the protein bands were estimated from the SEC–MALS results.

