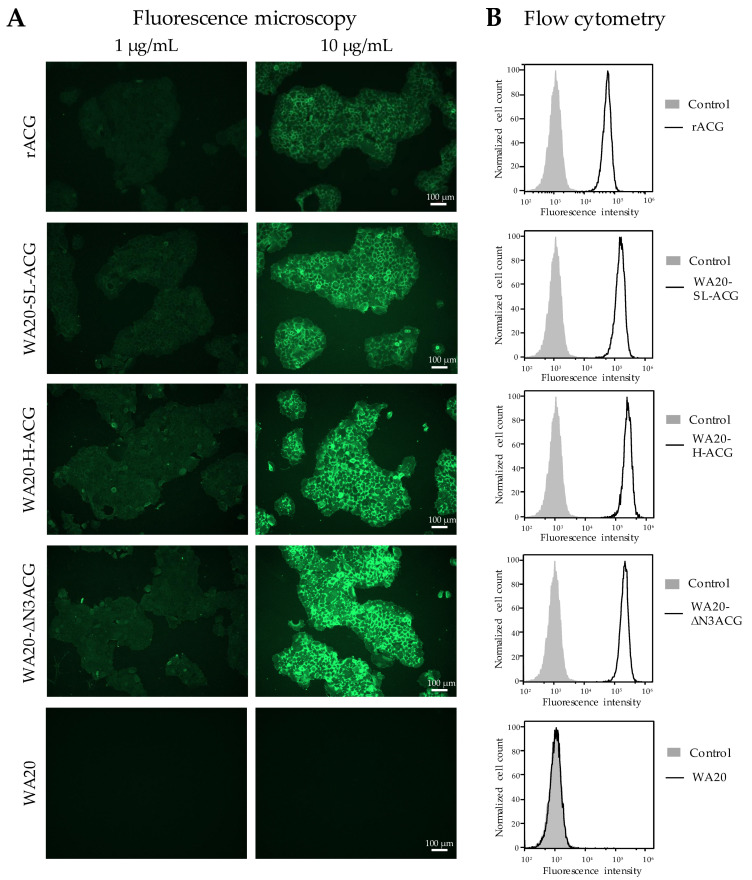
Figure 6.
Cell staining experiments. (A) Fluorescence microscopy images. BxPC-3 cells of a human pancreatic cancer cell line were stained with the fluorescein-labelled samples of lectin nano-blocks, rACG, and WA20. (B) Flow cytometry results. The experiments were performed on BxPC-3 cells. The histogram of each sample is shown with a black line. The negative control, fluorescein isothiocyanate (FITC)-labelled bovine serum albumin (BSA), is shown in the gray area.

