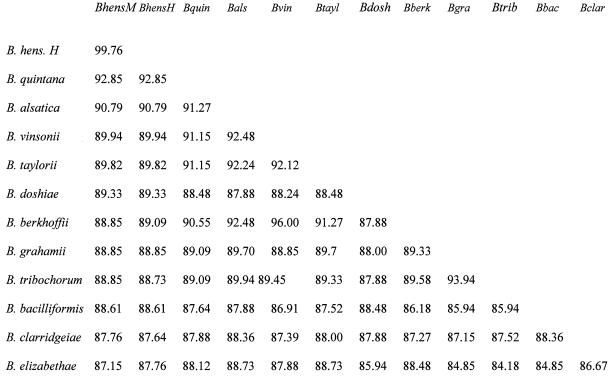
FIG. 2.
Similarity values between rpoB sequences of various Bartonella species. Values were deduced from the data presented in Fig. 1 by comparison of 825 nucleotides. BhensH, B. henselae Houston; BhensM, B. henselae Marseille; the remaining abbreviations across the top correspond to the species on the left, from top to bottom, respectively.

