Figure 1.
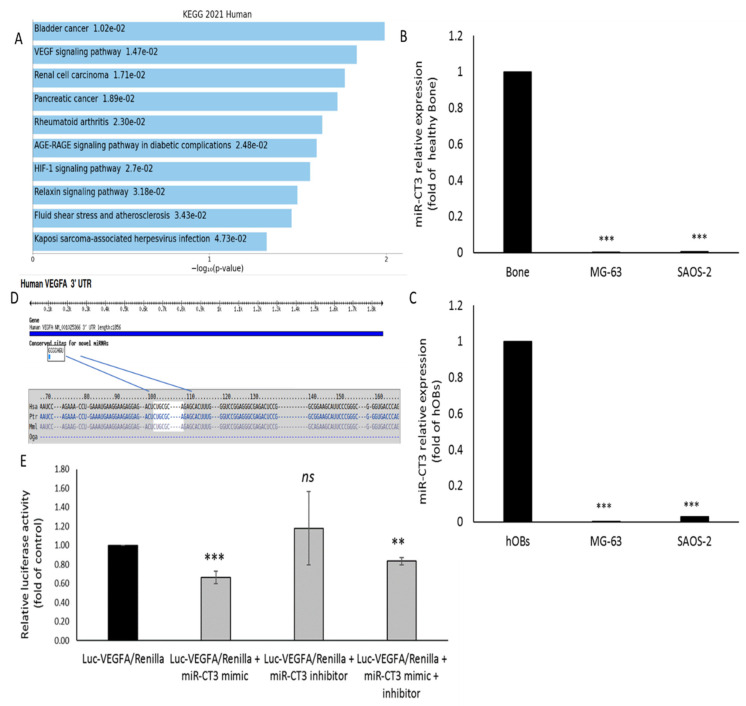
MiR-CT3 expression in OS cells and in silico analysis. (A) KEGG biological processes significantly enriched (pathways with p < 0.05) determined by Enrichr web platform (B) miR-CT3 expression in OS cell lines (SAOS-2 and MG-63) and human healthy bone. (C) miR-CT3 expression in SAOS-2, MG-63 and human primary Osteoblasts (hOBs). (D) Analysis output showing predicted conserved sites for miR-CT3 broadly conserved among vertebrates in 3′UTR VEGF-A mRNA determined by TargetScan7. (E) Dual luciferase assay of Hela cells co-transfected with firefly luciferase constructs containing the 3′UTR of VEGF-A and miR-CT3 mimic, miR-CT3 inhibitor or scrambled oligonucleotides (NC) as indicated. The firefly luciferase activity was normalized to renilla luciferase activity. The data are reported as relative luciferase activity of miR-CT-3-transfected cells as compared to the control (NC) of a total of 6 experiments from 3 independent transfections (Mean ± SD; ** p < 0.005; *** p < 0.0005).

