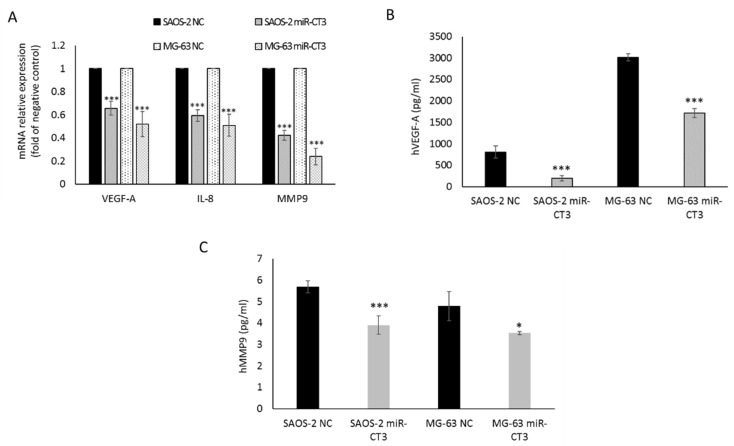
Figure 2.
MiR-CT3 over-expression decreases expression of angiogenic and invasive markers. (A) Barplot of mRNA relative expression as fold of negative control (NC) of VEGF-A, IL-8 and MMP9 in SAOS-2 and MG-63 cells transfected with miR-CT3 mimics and NC. (B) Barplot of ELISA assay of human VEGF-A protein levels in conditioned medium of SAOS-2 and MG-63 cells transfected with miR-CT3 mimics and NC. (C) Barplot of ELISA assay of human MMP9 protein levels in conditioned medium of SAOS-2 and MG-63 cells transfected with miR-CT3 mimics and NC. (Mean ± SD, n = 3 triplicate; * p < 0.05; *** p < 0.0005).

