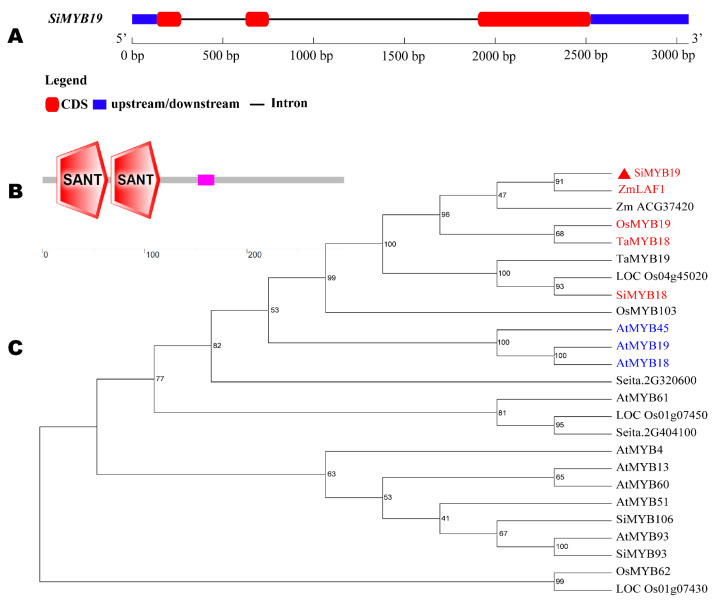
Figure 1.
SiMYB19 gene and protein structure and phylogenetic tree. (A) SiMYB19 gene structure. Blue is untranslated region (UTR). Red is exon. Black is intron. (B) SiMYB19 protein structure. Red polygon is SANT conserved domain. Numbers represent length of aa sequence from N-terminal to C-terminal. (C) SiMYB19 phylogenetic tree. Solid red triangle is SiMYB19. Red indicates highest homology to genes in maize (Zm), rice (Os), wheat (Ta), and foxtail millet (Si). Blue indicates highest homology to genes in Arabidopsis (At).

