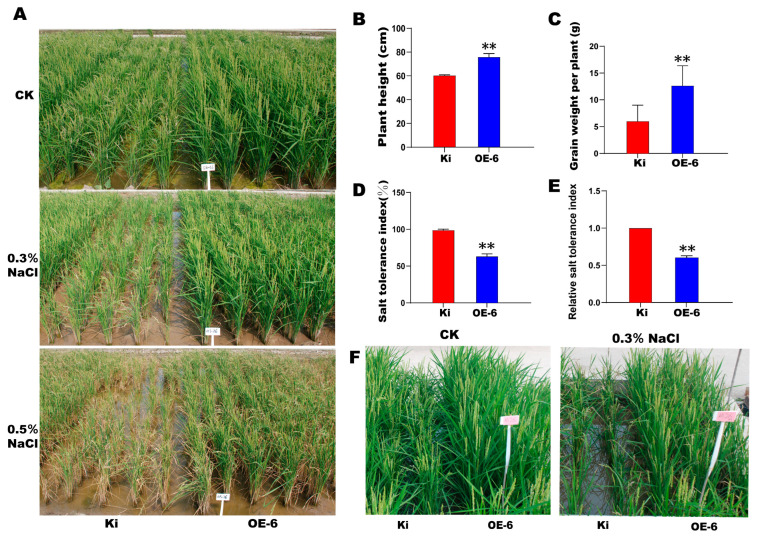
Figure 5.
Salt tolerance analysis of SiMYB19 transgenic rice grown in the field and in salt ponds. (A) Phenotypes of transgenic rice line OE-6 and WT (Ki) under normal field conditions (CK), 0.3% (w/v) NaCl, and 0.5% (w/v) NaCl. (B,C) Plant height and yield per WT and OE-6 plant under 0.3% (w/v) NaCl in the field. (D,E) Salt tolerance and relative salt tolerance indices of WT and OE-6 in the field. (F) Phenotypes of WT and OE-6 under normal conditions and 0.3% (w/v) NaCl treatment in salt ponds. ** p < 0.01.

