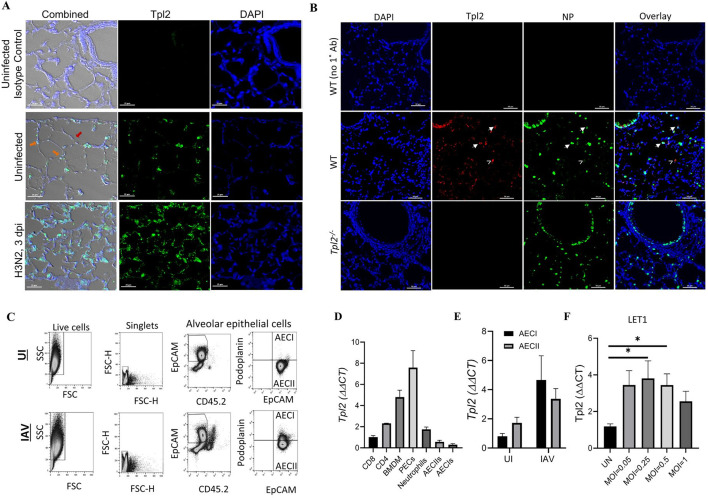
Fig 1. Tpl2 is expressed in pulmonary epithelial cells, and expression increases upon influenza infection.
(A) Representative images of Tpl2 expression within 4-μm lung sections mounted onto glass slides from wild-type (WT) mice. WT mice were either uninfected or infected with 104 PFU influenza A/ HK-x31 (x31) for 3 days. Lung sections were stained with rabbit anti-mouse IgG Isotype control or anti-mouse Tpl2 (Santa Cruz Biotechnology, clone M20) followed by goat anti-rabbit IgG AlexaFluor 488, and the nuclei were counterstained with DAPI. Slides were imaged using confocal microscopy. Data are representative of 3 experiments. Orange arrows—AECIIs, Red arrow—AECIs. (B) Representative images of influenza A/x31 nucleoprotein (NP) and Tpl2 expression in lung sections from WT and Tpl2-/- mice infected with influenza for 3 days as in A. Cells were stained with anti-NP antibody (with AlexaFluor 488 secondary) and anti-Tpl2 M-20 (with AlexaFluor 594 secondary) with a DAPI counterstain. Carets denote Tpl2 co-staining with NPdim cells; arrowheads denote Tpl2 co-staining with NPbright alveolar cells. Data are representative of at least 3 mice. (C) Representative flow plot from lung cells magnetically depleted with biotinylated antibodies against hematopoietic cells (CD45), alveolar macrophages (CD45 and CD16/32), endothelial cells (CD31), erythroid cells (Ter119), club cells (integrin β4), and distal lung progenitor cells (integrin β4) prior to staining for distinction between AECI and AECII. AECI (EpCAM+CD45.2-Podoplanin+) and AECII (EpCAM+CD45.2-) populations were gated as shown and sorted for RT-PCR analyisis of Tpl2. (D) Naïve splenic CD4+ and CD8+ T cells, bone marrow-derived macrophages (BMDM), adherence purified peritoneal exudate cells (PECs), neutrophils, and lung alveolar epithelial cells (AECI and AECII) were isolated from WT, age- and sex-matched mice as in C. Tpl2 expression was measured by RT-PCR relative to an actin control. All samples were normalized to CD8+ T cells, which were arbitrarily designated 1. Data are representative of 3 experiments. (E) Isolated alveolar epithelial cells (AECI and AECII) from WT, age- and sex-matched mice as in C were uninfected or infected with 104 PFU influenza A/x31 for 3 days. Tpl2 expression was quantified by RT-PCR. N = 4. (F) LET1 cells were cultured for 24 hours then left uninfected or infected with a MOI of 0.05, 0.25, 0.5, or 1 of influenza A/x31 (H3N2) for 24 hours. RNA lysates were collected after 24 hours, and Tpl2 expression was measured by RT-PCR. Pooled data from 3 experiments. Error bars represent means ± SEM. Error bars represent means ± SEM. *p < 0.05, ** p < 0.01, ***p < 0.001, ****p < 0.0001; one-way ANOVA.

