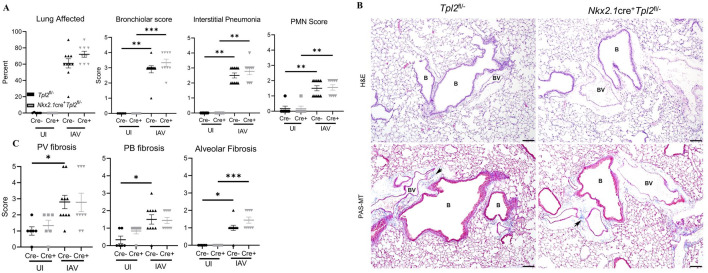
Fig 4. Nkx2.1cre+Tpl2fl/- mice have normal pulmonary histological profiles at 7 dpi with influenza A virus.
(A) Inflammation scoring of Tpl2fl/- and Nkx2.1cre+Tpl2fl/- mice at 8.5 dpi with 104 PFU influenza A/x31. Lungs sections were stained with hematoxylin and eosin and scored by a pathologist blinded to sample identity. Tpl2fl/-, N = 16 (6 controls, 10 experimental). Nkx2.1cre+Tpl2fl/-, N = 15 (6 controls, 9 experimental). (B) Representative images of Tpl2fl/- and Nkx2.1cre+Tpl2fl/- lung sections stained with hematoxylin and eosin (H&E) at 8.5 dpi (top panels) and Periodic Acid Schiff, counterstained with hematoxylin and Masson’s trichrome stain (PAS-MT) at 8.5 dpi (bottom panels). B (Bronchiole), BV (Blood Vessel). Arrows point to areas of fibrosis as indicated by blue staining in PAS-MT panels. Data representative of 2 experiments. (C) Fibrosis scoring. Lung sections as in B were scored for fibrosis by a pathologist blinded to sample identity. Scoring was on a scale of 1–5 of the worst affected structure relative to normal thickness. Perivascular (PV), Peribronchiolar (PB), Alveolar fibrosis. Tpl2fl/-, N = 16 (6 controls, 10 experimental). Nkx2.1cre+Tpl2fl/-, N = 15 (6 controls, 9 experimental). Data representative of 2 experiments. Error bars represent means ± SEM. *p < 0.05, ** p< 0.01, ***p < 0.001; Kruskal-Wallis nonparametric test with Dunn’s multiple comparisons post-test.

