Figure 4.
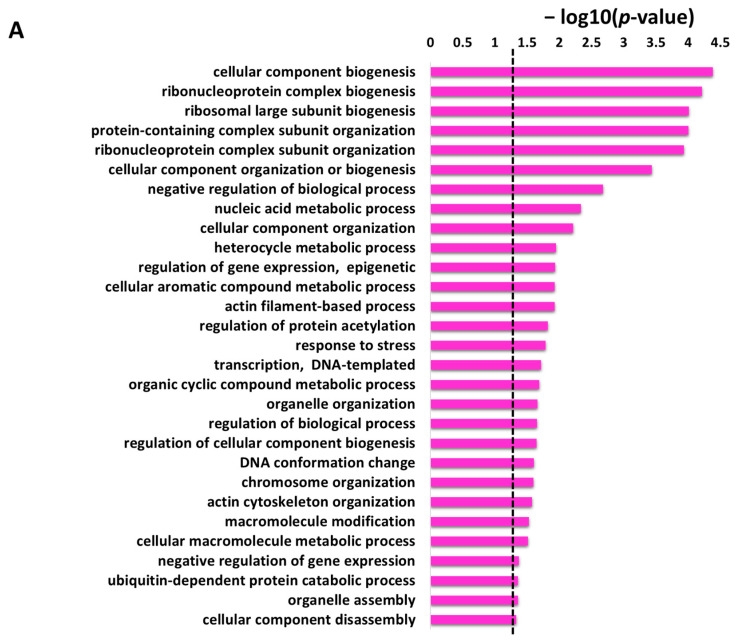
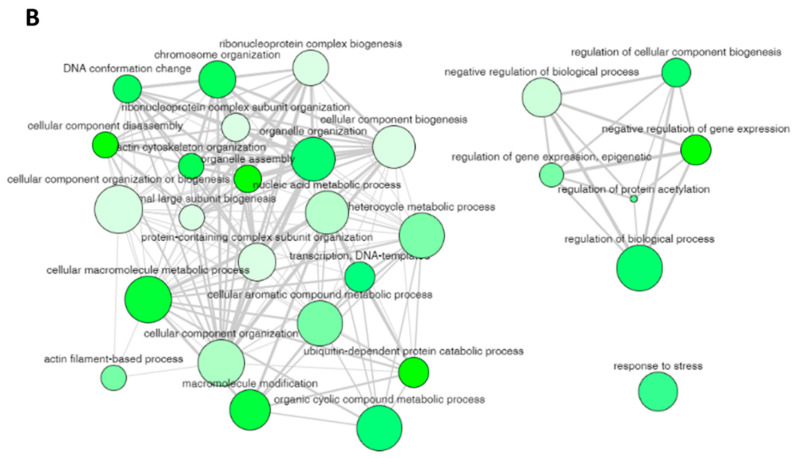
REVIGO analysis for the non-redundant enrichment items in the biological process. (A) The 29 non-redundant enrichment items in the biological process that were retained in REVIGO analysis obtained from DAVID database with the corresponding p-value of these items (the dotted line represents p-value = 0.05). (B) Cluster between the non-redundant items with similar biological process. The non-redundant terms are represented by bubbles and the color of the bubbles illustrate the user-provided p-value (lowest p-value is light green color whereas the highest p-value = 0.05 has dark green color). The size of the bubbles indicates the frequency of each GO term identified in the Gene Ontology Annotation database (larger bubbles are for more general terms). The width of the line connecting the bubbles represents the degree of similarity.


