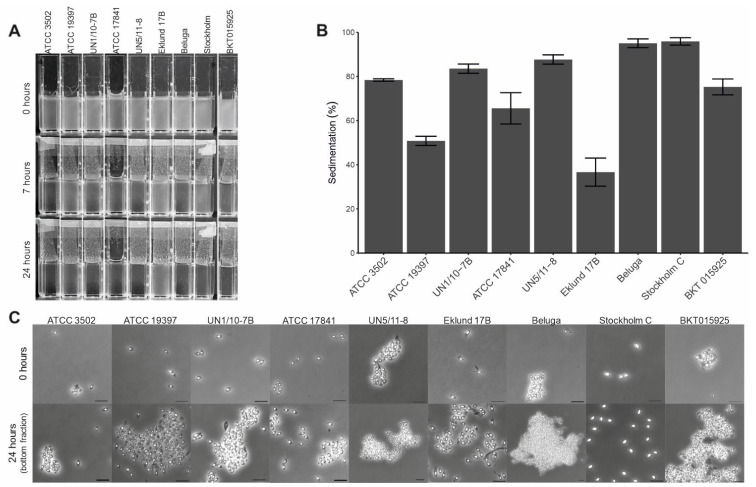
Figure 6.
Autoaggregation of Clostridium botulinum spores. (A) Photographic screening of the rate of sedimentation in spore suspensions of each strain, (B) assessment of spore deposition by decrease in OD600nm, columns representing the average of three replicates with standard deviation shown by the error bars. (C) Phase contrast microscopy of the initial suspension and bottom fraction after 24 h of deposition. Scale bars represent 2 µm.

