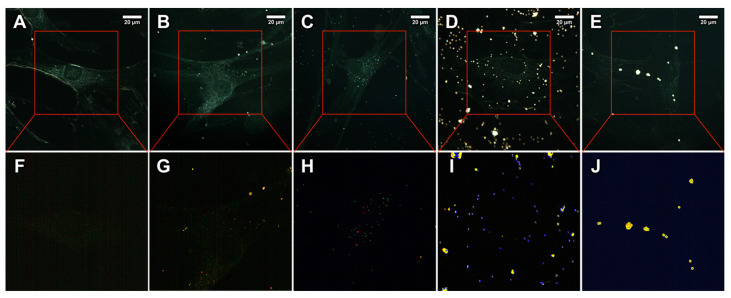
Figure 3.
Dark-field images (upper row) and corresponding hyperspectral images merged with maps (bottom row) demonstrating the distribution of polystyrene particles in HSF after 24 h of co-incubation: control (A,F); 100 nm (B,G); 200 nm (C,H); 500 nm (D,I); and 1000 nm (E,J). Red-, green-, blue- and yellow-coloured pixels on hyperspectral images denotes 100, 200, 500, and 1000 nm particles mapped by Spectral Angle Mapper, respectively.

