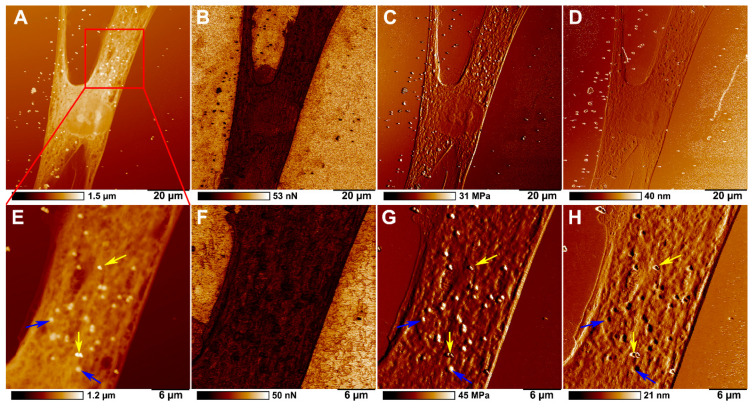
Figure 6.
AFM images of topography (A,E), adhesion (B,F), Young’s modulus (DMT modulus) (C,G), and deformation (D,H) showing the distribution of 500 nm polystyrene particles in HSF after 24 h co-incubation. The yellow arrows indicate polystyrene particles on the cell surface, and the blue arrows indicate particles inside the cells.

