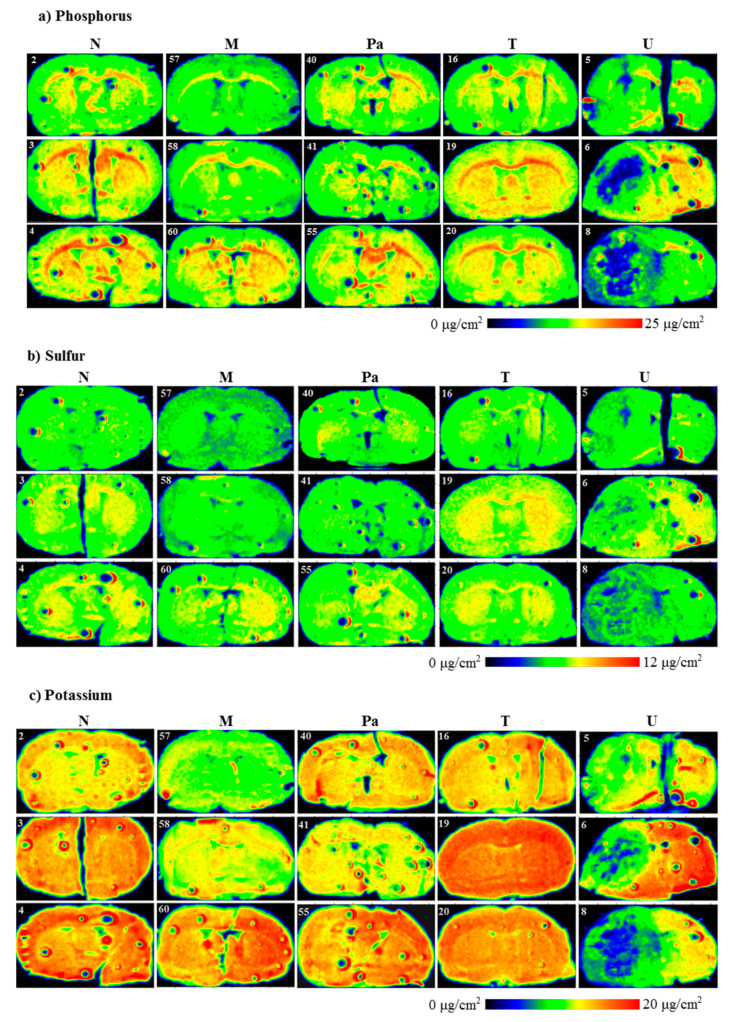
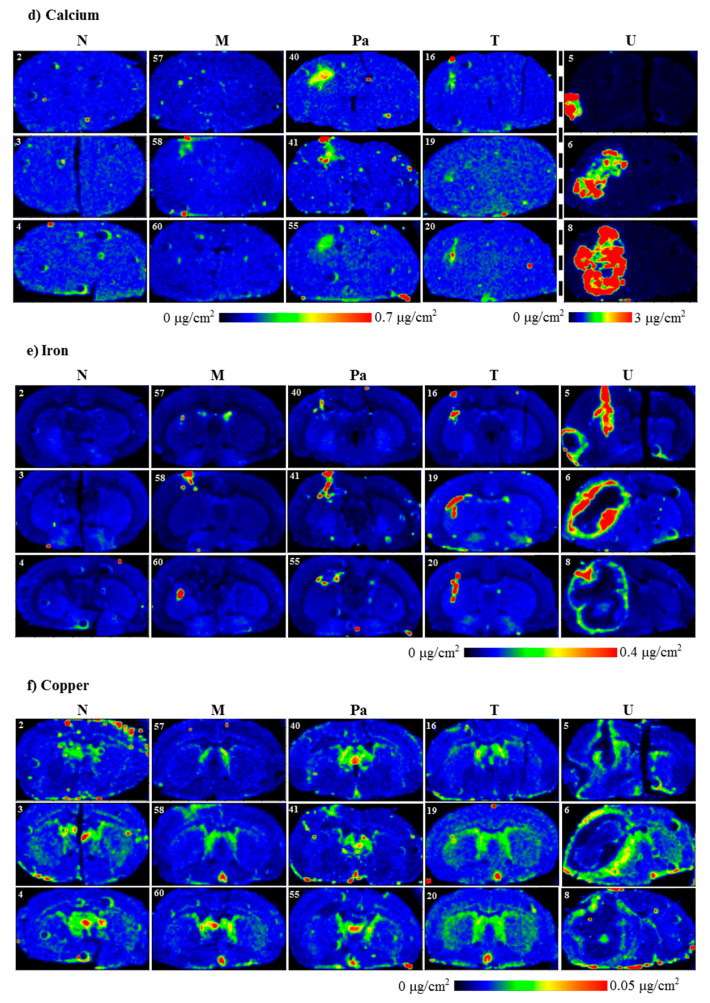
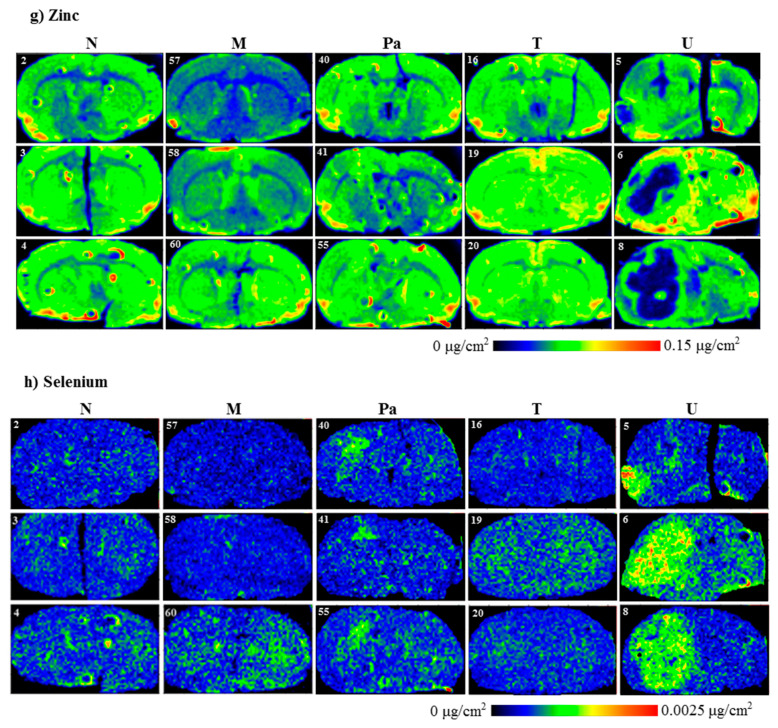
Figure 3.
Topographic elemental maps of brain slices taken from the rats of all experimental groups for: (a) phosphorus, (b) sulfur, (c) potassium, (d) calcium, (e) iron, (f) copper, (g) zinc and (h) selenium. Color scales express areal densities of elements in μg/cm2. In the case of Ca, large differences in areal densities were observed between groups N, M, Pa, T and group U. Two different scales were applied for better visualization of the distribution of this element.


