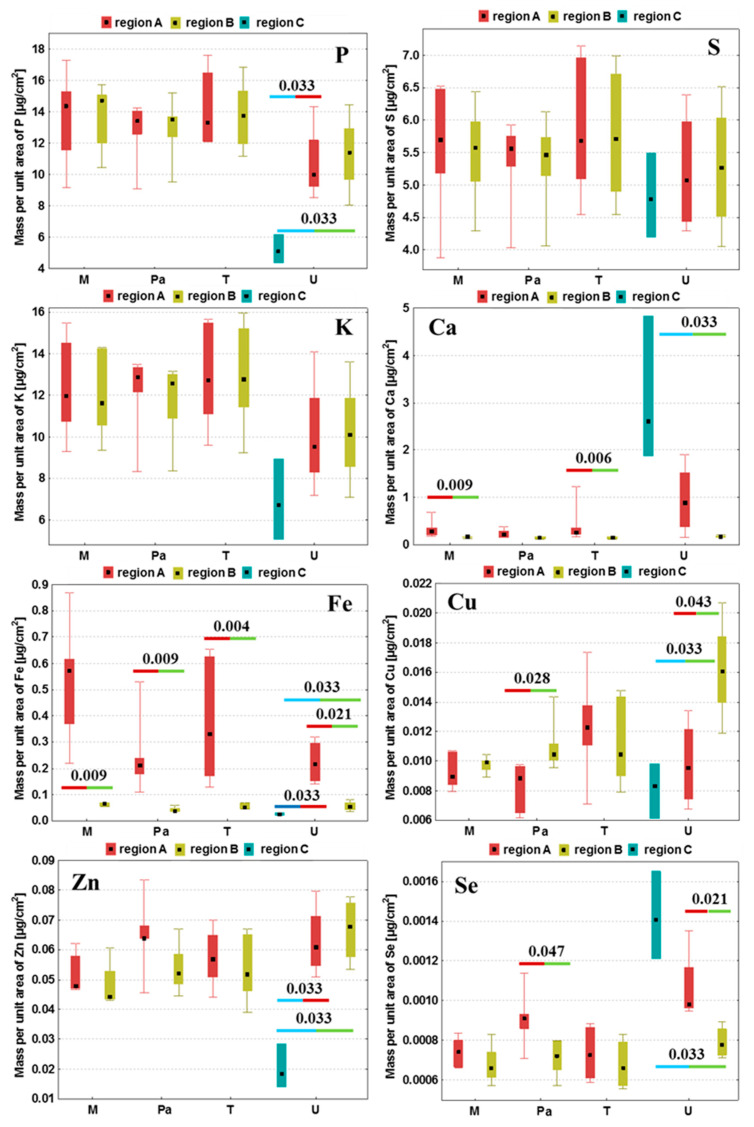
Figure 5.
Medians, minimal and maximal values as well as interquartile spans of areal densities of P, S, K, Ca, Fe, Cu, Zn and Se in the examined tissue regions obtained for groups M, Pa, T and U. Region A—tumor (groups Pa and U) or place where DMEM/T98g cells were administered (groups M and T, respectively); region B—surroundings of the tumor or place where DMEM/T98g cells were administered; C—tumor debris defined in the case of the U group. Statistically significant differences between the compared areas within the same experimental group were marked with p-values of the U test.

