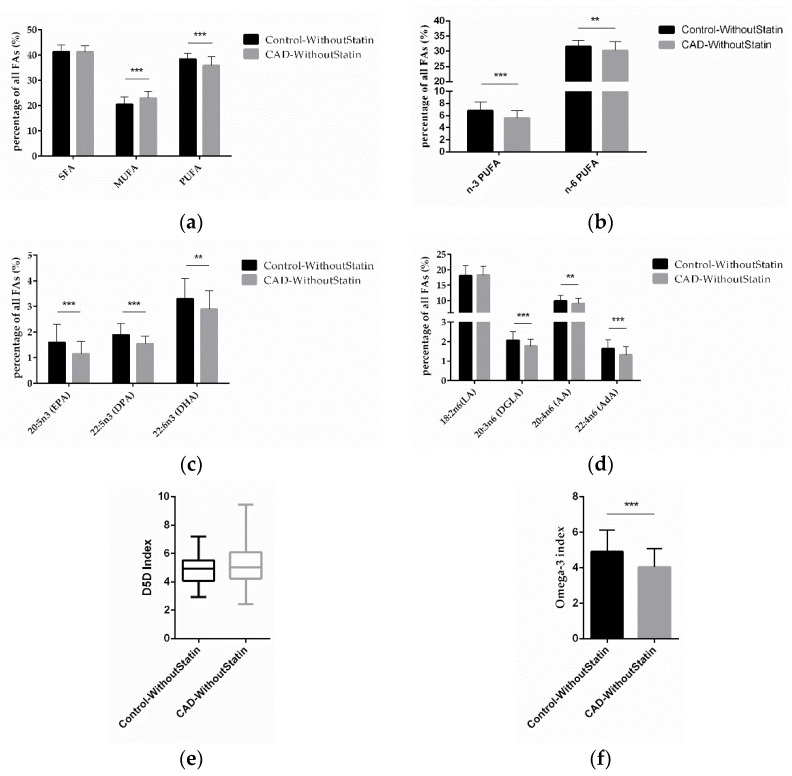
Figure 4.
Correlation of FAs in control and CAD patient subgroups without statin treatment. (a) Relative content of SFAs, MUFAs, and PUFAs in control and CAD patients without statin treatment. (b) Relative content of n-3 and n-6 PUFAs in control and CAD patients without statin treatment. (c) Relative content of different n-3 PUFAs and (d) n-6 PUFAs in control and CAD patients without statin treatment. (e) D5D index and (f) omega-3 index in control and CAD patients without statin treatment. (n = 70 for the control-without-statin group, n = 72 for the CAD-without-statin group; ** indicates 0.001 < p < 0.01, *** indicates p < 0.001).

