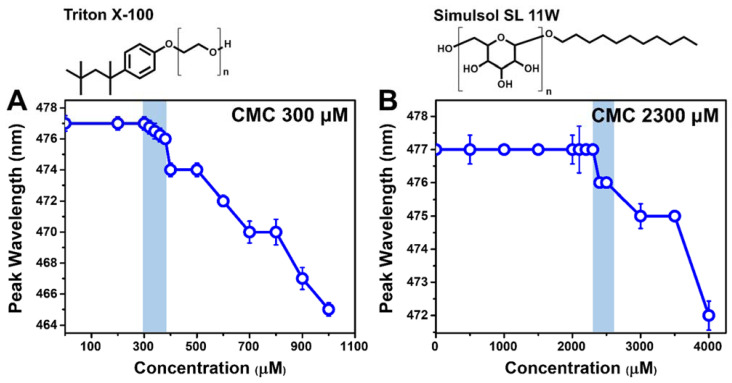
Figure 1.
Critical micelle concentration (CMC) values for TX-100 and SL-11W based on fluorescence spectroscopy measurements. Peak wavelength of fluorescent probe (1-pyrenecarboxaldehyde) as a function of test compound concentration in PBS for (A) TX-100 and (B) SL-11W. The chemical structure of each detergent molecule is presented above the corresponding graph. The n values for TX-100 and SL-11W are 9–10 and 1–1.25, respectively, and were defined accordingly to be 9.5 and 1 for molecular weight calculations. Each data point represents the mean ± standard deviation from four technical replicates. The highest compound concentration at which there is no peak shift (relative to the baseline) is defined as the CMC value and indicated by shading.

