Figure 4.
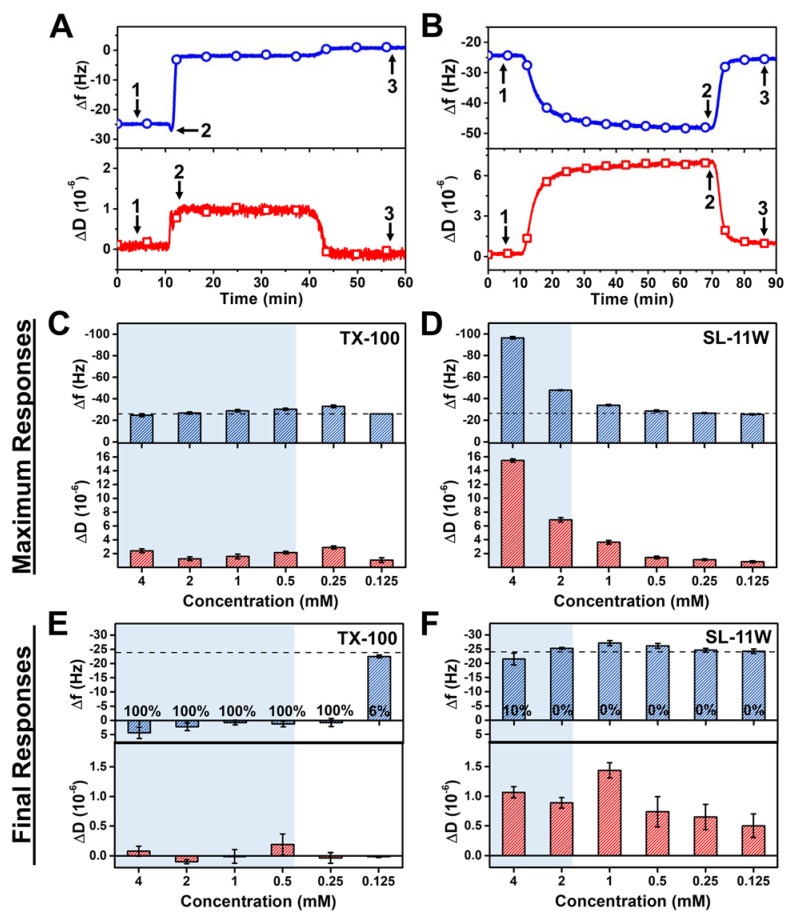
Comparison of QCM-D measurement responses for TX-100 and SL-11W interactions with SLB platform. Representative QCM-D measurement signals and corresponding data points that were used to define the baseline (arrow 1) and to calculate the maximum (arrow 2) and final (arrow 3) responses due to (A) TX-100 and (B) SL-11W detergent interactions with the SLB platform. Maximum ∆f (top panel) and ∆D (bottom panel) shifts corresponding to transient interaction processes occurring between (C) TX-100 or (D) SL-11W detergents and SLB platform. Final ∆f (top panel) and ∆D (bottom panel) shifts post-treatment corresponding to membrane-disruptive effects of (E) TX-100 and (F) SL-11W detergents on SLB platform after the last buffer washing step. The dashed lines denote the typical measurement values for a complete SLB adlayer. Shaded regions indicate concentration ranges in which the compounds are in the micellar state and the percentage values listed in (E,F) correspond to SLB removal fractions according to the Sauerbrey equation. Data are reported as mean ± standard deviation from four measurements.

