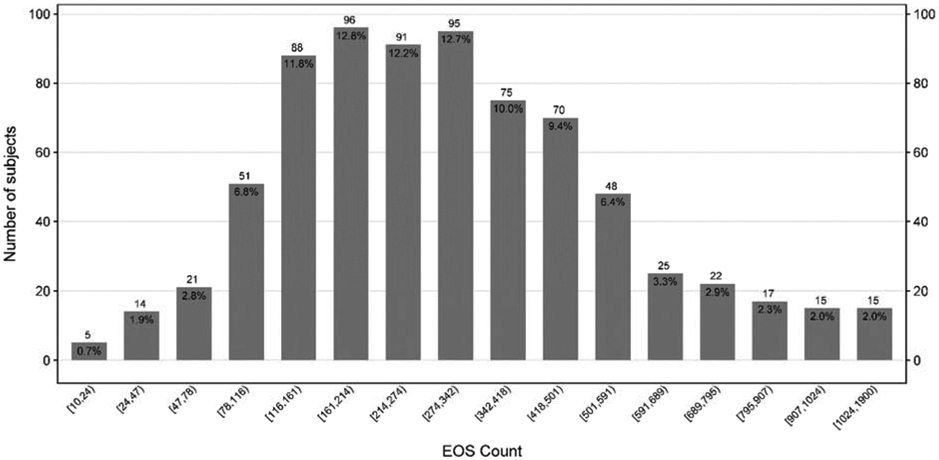
Figure 1C:

Distribution of Total Eosinophils Count
Bar chart displaying the total number of subjects for each aeroallergen sensitization category (A), Total IgE category (B) and Eosinophils count (C), with n and (%) annotated above and below each bar respectively. Number of sensitizations is defined as the sum of a positive skin test OR a positive specific IgE to the following aeroallergen groupings: cat, dog, rodent, dust mite, cockroach, mold, and ragweed. The numbers below the columns indicate the range of IgE levels and Eosinophils count for participants within that column.
