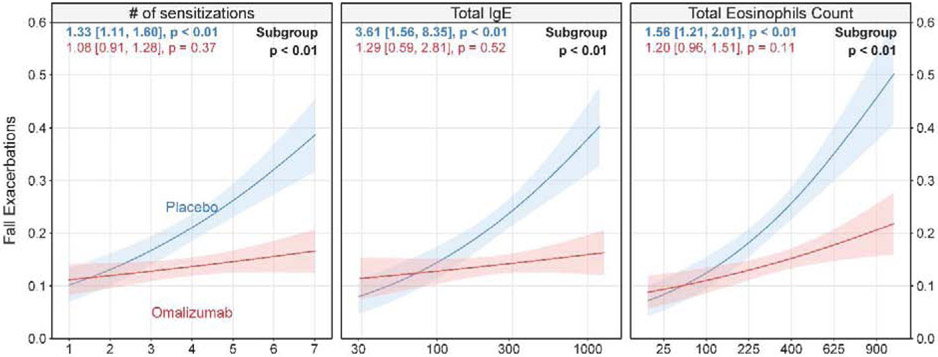
Figure 2:
Relationship between number of aeroallergen sensitizations, total serum IgE and serum eosinophil count with fall exacerbations
Probability of fall exacerbation vs. number of aeroallergen sensitizations (left panel), total IgE (middle panel) and Total Eosinophils Count (right panel) by treatment group. Pink and blue lines represent omalizumab and placebo-treated subjects, respectively. Lines and associated confidence bands (+/− 1 standard error) are least squares estimates from logistic regression models. Colored numbers are odds ratio [95% confidence interval] for a unit, log-unit and five square root unit increase in each variable respectively, followed by the associated p-value within treatment group. Subgroup p-value < 0.10 indicates significantly different subgroups. Results represent pooled ICATA and PROSE participants.

