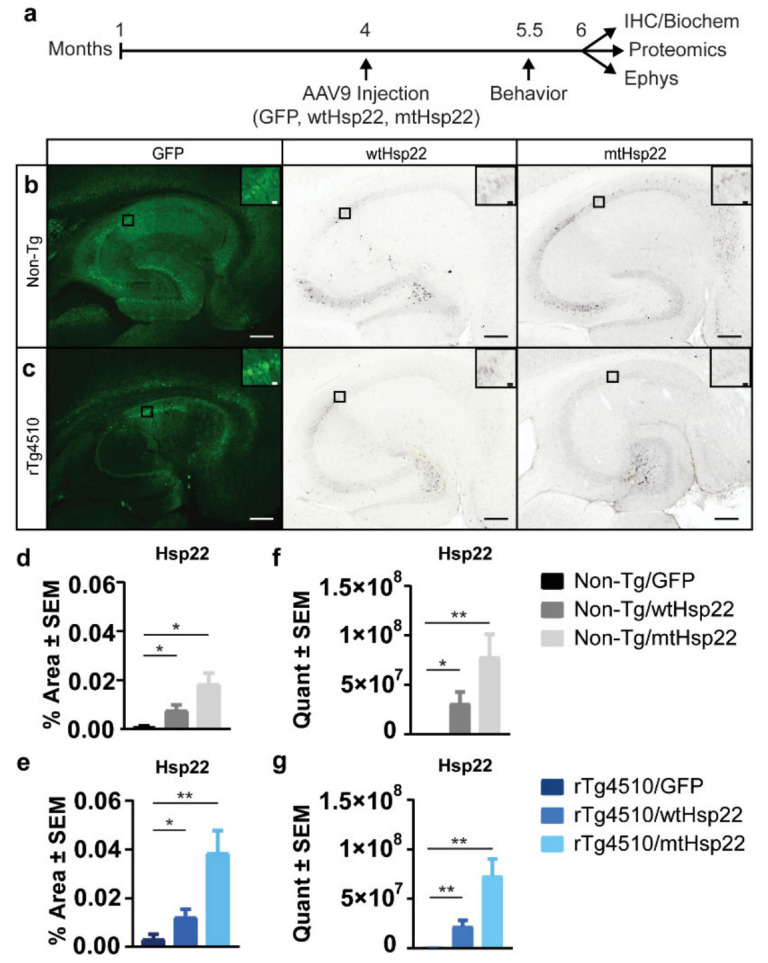
Figure 1.

Hsp22 levels were significantly upregulated by AAV9. (a) Timeline of in vivo study. (b) Representative images of GFP, wtHsp22, and mtHsp22 levels in non-transgenic (Non-Tg) mice. (c) Representative images of GFP, wtHsp22, and mtHsp22 levels in rTg4510 mice. Scale bar represents 200 µm; inset represents 20 µm. (d) Quantification of immunohistochemical staining of Hsp22 levels in non-Tg mice (mean ± SEM, * p < 0.05) and (e) rTg4510 mice (mean ± SEM, * p < 0.05, ** p < 0.01) GFP (n = 5/Non-Tg; n = 7/rTg4510), wtHsp22 (n = 7/Non-Tg; n = 6/rTg4510) mtHsp22 (n = 6/Non-Tg; n = 6/rTg4510). (f) Quantification of Hsp22 levels in non-Tg mice by parallel reaction monitoring (mean ± SEM, * p < 0.05, ** p < 0.01). (g) Quantification of Hsp22 levels in rTg4510 mice by quantitative mass spectrometry parallel reaction monitoring (mean ± SEM, ** p < 0.05). GFP (n = 6/Non-Tg; n = 6/rTg4510), wtHsp22 (n = 7/Non-Tg; n = 6/rTg4510) mtHsp22 (n = 6/Non-Tg; n = 6/rTg4510).
