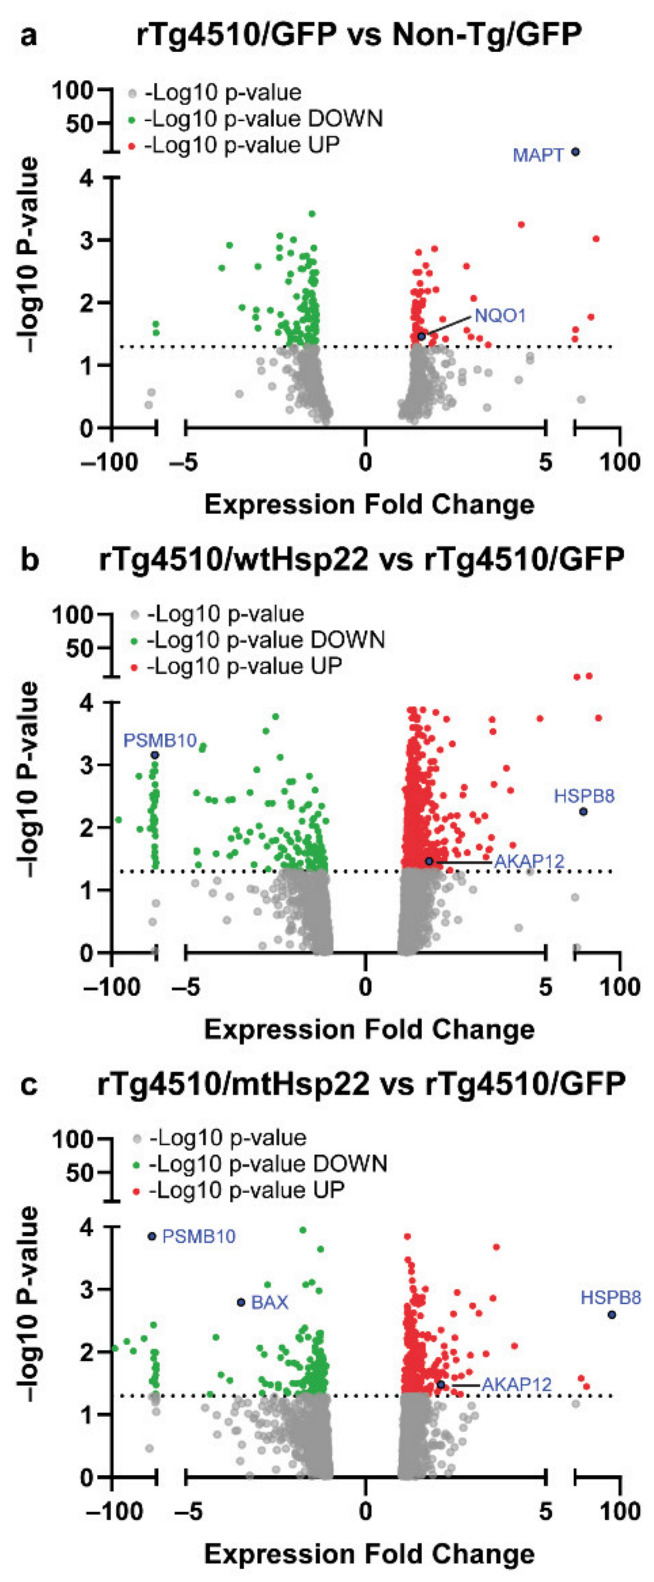
Figure 6.

wtHsp22 and mtHsp22 overexpression significantly regulates key neuroprotective proteins. Protein-fold change was calculated using average LFQ intensities among samples where rTg4510/GFP was compared to non-transgenic (Non-Tg)/GFP, rTg4510/mtHsp22 was compared to rTg4510/GFP, and rTg4510/wtHsp22 was compared to rTg4510/GFP. (a) rTg4510/GFP vs. non-Tg/GFP (; (b) rTg4510/mtHsp22 vs. rTg4510/GFP (; (c) rTg4510/wtHsp22 vs. rTg4510/GFP (. Expression-fold change values were plotted against the corresponding –log10 (p-value) for each protein to generate volcano plots; horizontal dotted line represents the cutoff for statistical significance via Welch’s t-test (p > 0.05).
