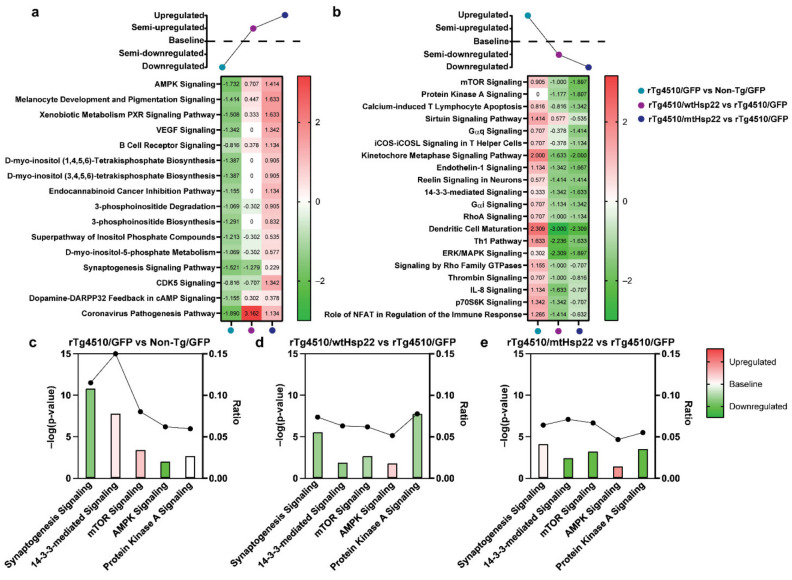
Figure 7.
#wtHsp22 and mtHsp22 overexpression shifts key canonical pathways—AMPK signaling, synaptogenesis signaling, mTOR signaling, PKA signaling, and 14-3-3-mediated signaling in rTg4510 mice towards non-transgenic levels. Comparison analysis of canonical pathways annotated by IPA’s core analysis module regulated by rTg4510/GFP vs. Non-transgenic (Non-Tg)/GFP, rTg4510/wtHsp22 vs. rTg4510/GFP, and rTg4510/mtHsp22 vs. rTg4510/GFP comparison analysis. (a) Heat map based on trend and z-score, where rTg4510/GFP vs. WT/GFP had pathways that were downregulated based on genotype effect, rTg4510/wtHsp22 vs. rTg4510/GFP had pathways that were semi-upregulated based on treatment, and rTg4510/mtHsp22 vs. rTg4510/GFP had pathways that were upregulated based on treatment. (b) Heat map based on trend and z-score, where rTg4510/GFP vs. Non-Tg/GFP had pathways that were upregulated based on genotype effect, rTg4510/wtHsp22 vs. rTg4510/GFP had pathways that were semi-downregulated based on treatment, and rTg4510/mtHsp22 vs. rTg4510/GFP had pathways that were downregulated based on treatment. (c) Key canonical signaling pathways annotated by IPA’s core analysis module for rTg4510/GFP vs. Non-Tg/GFP; (d) rTg4510/wtHsp22 vs. rTg4510/GFP; and (e) rTg4510/mtHsp22 vs. rTg4510/GFP. X axis indicates pathways (synaptogenesis signaling, 14-3-3-mediated signaling, mTOR signaling, AMPK signaling, protein-kinase-A-signaling); left Y axis denotes -log(p-value) derived from Fischer’s exact test, right-tailed; right Y axis (points on black line) represents ratio of dataset proteins to total known proteins for that pathway. Red bars indicate predicted activation (positive z-score), green bars indicate predicted inhibition (negative z-score), and white bars represent no activation or inhibition (0 z-score).

