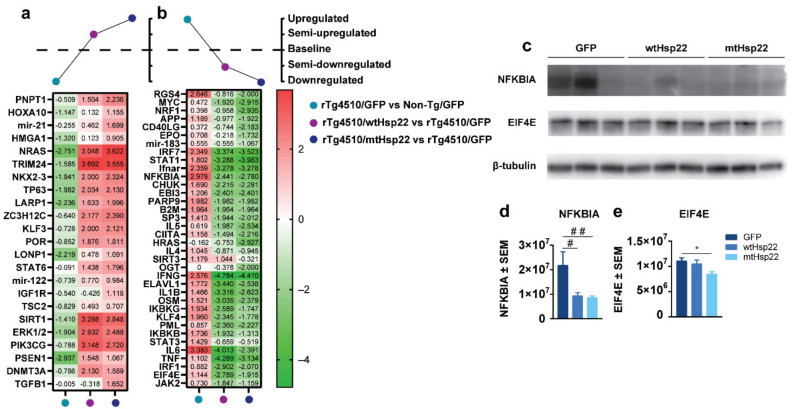
Figure 8.
wtHsp22 and mtHsp22 overexpression shifts key upstream regulators EIF4E and NFKBIA towards non-transgenic levels in rTg4510 mice. Comparison analysis of upstream regulators annotated by IPA’s core analysis module regulated by rTg4510/GFP vs. Non-transgenic (Non-Tg)/GFP, rTg4510/wtHsp22 vs. rTg4510/GFP, and rTg4510/mtHsp22 vs. rTg4510/AAV9 GFP. (a) Heat map based on trend and z-score, where rTg4510/GFP vs. Non-Tg/GFP had upstream regulators that were downregulated based on genotype effect, rTg4510/wtHsp22 vs. rTg4510/GFP had upstream regulators that were semi-upregulated based on treatment, and rTg4510/mtHsp22 vs. rTg4510/GFP had upstream regulators that were upregulated based on treatment. (b) Heat map based on trend and z-score, where rTg4510/GFP vs. Non-Tg/GFP had upstream regulators that were upregulated based on genotype effect, rTg4510/wtHsp22 vs. rTg4510/GFP had upstream regulators that were semi-downregulated based on treatment, and rTg4510/mtHsp22 vs. rTg4510/GFP had upstream regulators that were downregulated based on treatment. Immunoblotting and quantification of hippocampi of rTg4510 mice with GFP (n = 3), wtHsp22 (n = 3), or mtHsp22 (n = 3). (c) Immunoblot of EIF4E and NFKBIA. (d,e) Quantification of EIF4E and NFKBIA (mean ± SEM, # p < 0.07, ## p < 0.06, * p < 0.04).

