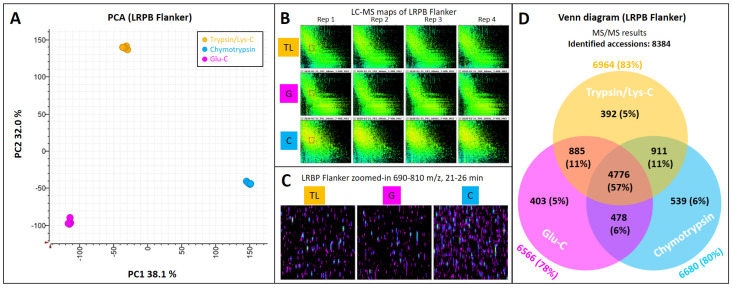
Figure 4.
Testing proteases. Twenty milligrams (±0.2 mg) from three wheat cultivars (LRPB Mustang, LRPB Impala, LRPB Flanker) was weighed in four replicates, extracted using 0.5 mL Gnd-HCl buffer. Protein extracts were assayed to obtain protein concentrations and 100 µg proteins were digested using chymotrypsin, Glu-C, or trypsin/Lys-C proteases. LC–MS/MS data were acquired using LC method 1. (A) PC1 vs. PC2 plot based on LC–MS quantitative data; (B) LC–MS maps of LRPB Flanker cultivar for each of the proteases tested across four technical replicates, boxed sections are zoomed-in in panel C; (C) zoomed-in section of LC–MS maps at 21–26 min and 690–810 m/z to highlight cluster qualitative and quantitative differences; (D) Venn diagram of the identified accessions for each protease. TL, trypsin/Lys-C; G, Glu-C; C, chymotrypsin.

