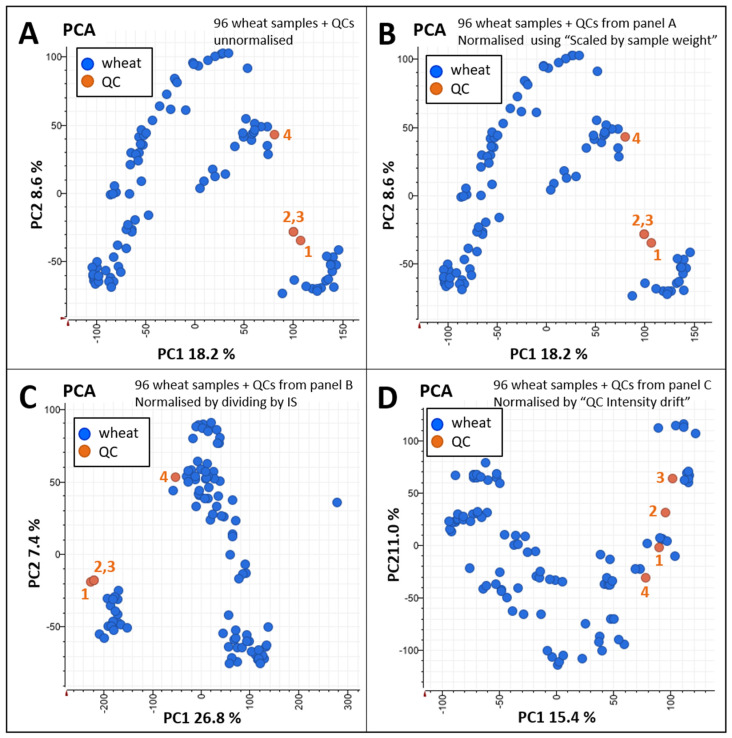
Figure 7.
Principal component analysis (PCA) for method validation. Twenty milligrams (±0.2 mg) from 96 wheat cultivars was weighed, extracted using 0.5 mL Gnd-HCl buffer, and 10 µL extract aliquots were digested using trypsin/Lys-C. QCs and IS are described in the Materials and Methods. LC–MS data were acquired using LC method 6. (A) PC1 vs. PC2 plot based on unnormalised LC–MS quantitative data of the 96 wheat and QCs samples; (B) PC1 vs. PC2 plot based on LC–MS quantitative data from panel A normalised using the sample weights; (C) PC1 vs. PC2 plot based on LC–MS quantitative data from panel B normalised using the IS cluster; (D) PC1 vs. PC2 plot based on LC–MS quantitative data from panel C normalised using the injection order of the QCs (indicated with the orange numbers) and the ‘intensity drift’ algorithm of Genedata Analyst.

