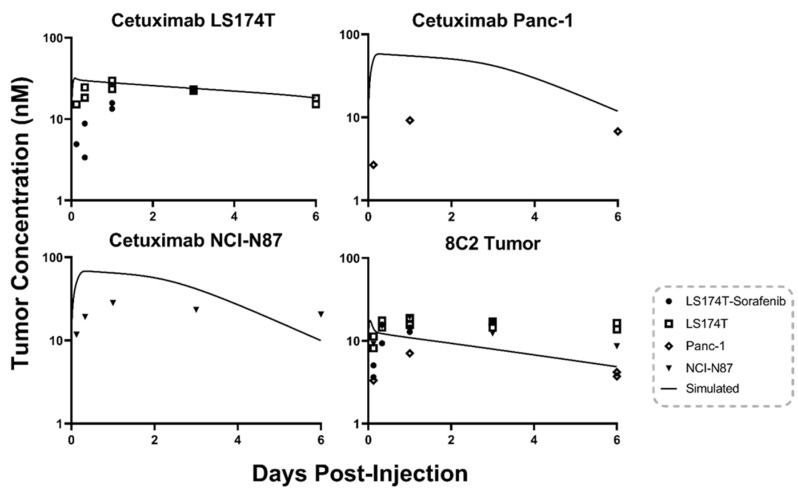
Figure 3.
Base PBPK Model Prediction: The tumor concentration over time profile predictions made using the base PBPK model for 8C2 (bottom right) and cetuximab. Points represent the observed antibody concentration for a single xenograft. Cetuximab predictions are separated into three panels as cell-line specific EGFR concentrations were incorporated into the cetuximab model predictions.

