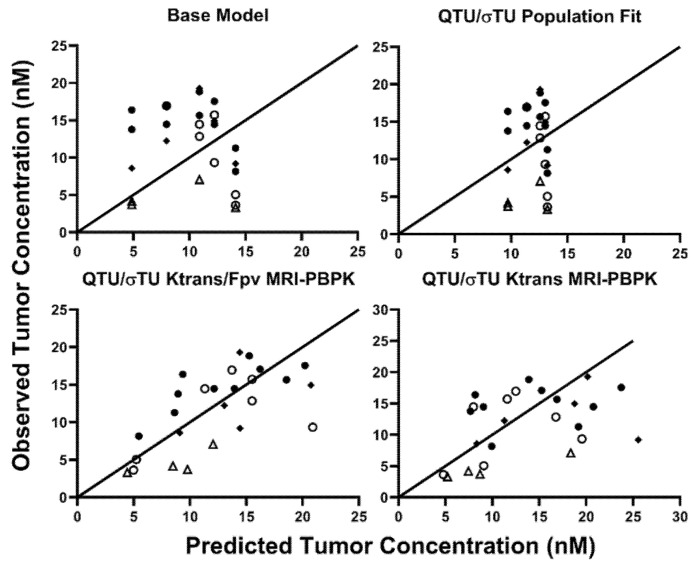
Figure 5.
Observed vs. Predicted 8C2 Tumor Concentrations: Predicted vs. observed plots demonstrating the unity of predictions with the base model, population fit model, and the two-best covariate-integrated models. Tumor data in LS174T tumors following treatment with Sorafenib are represented in open circles, naïve LS174T tumors are depicted in closed circles. Panc-1 tumors are represented by an upright open triangle, and NCI-N87 data are represented by closed diamonds.

