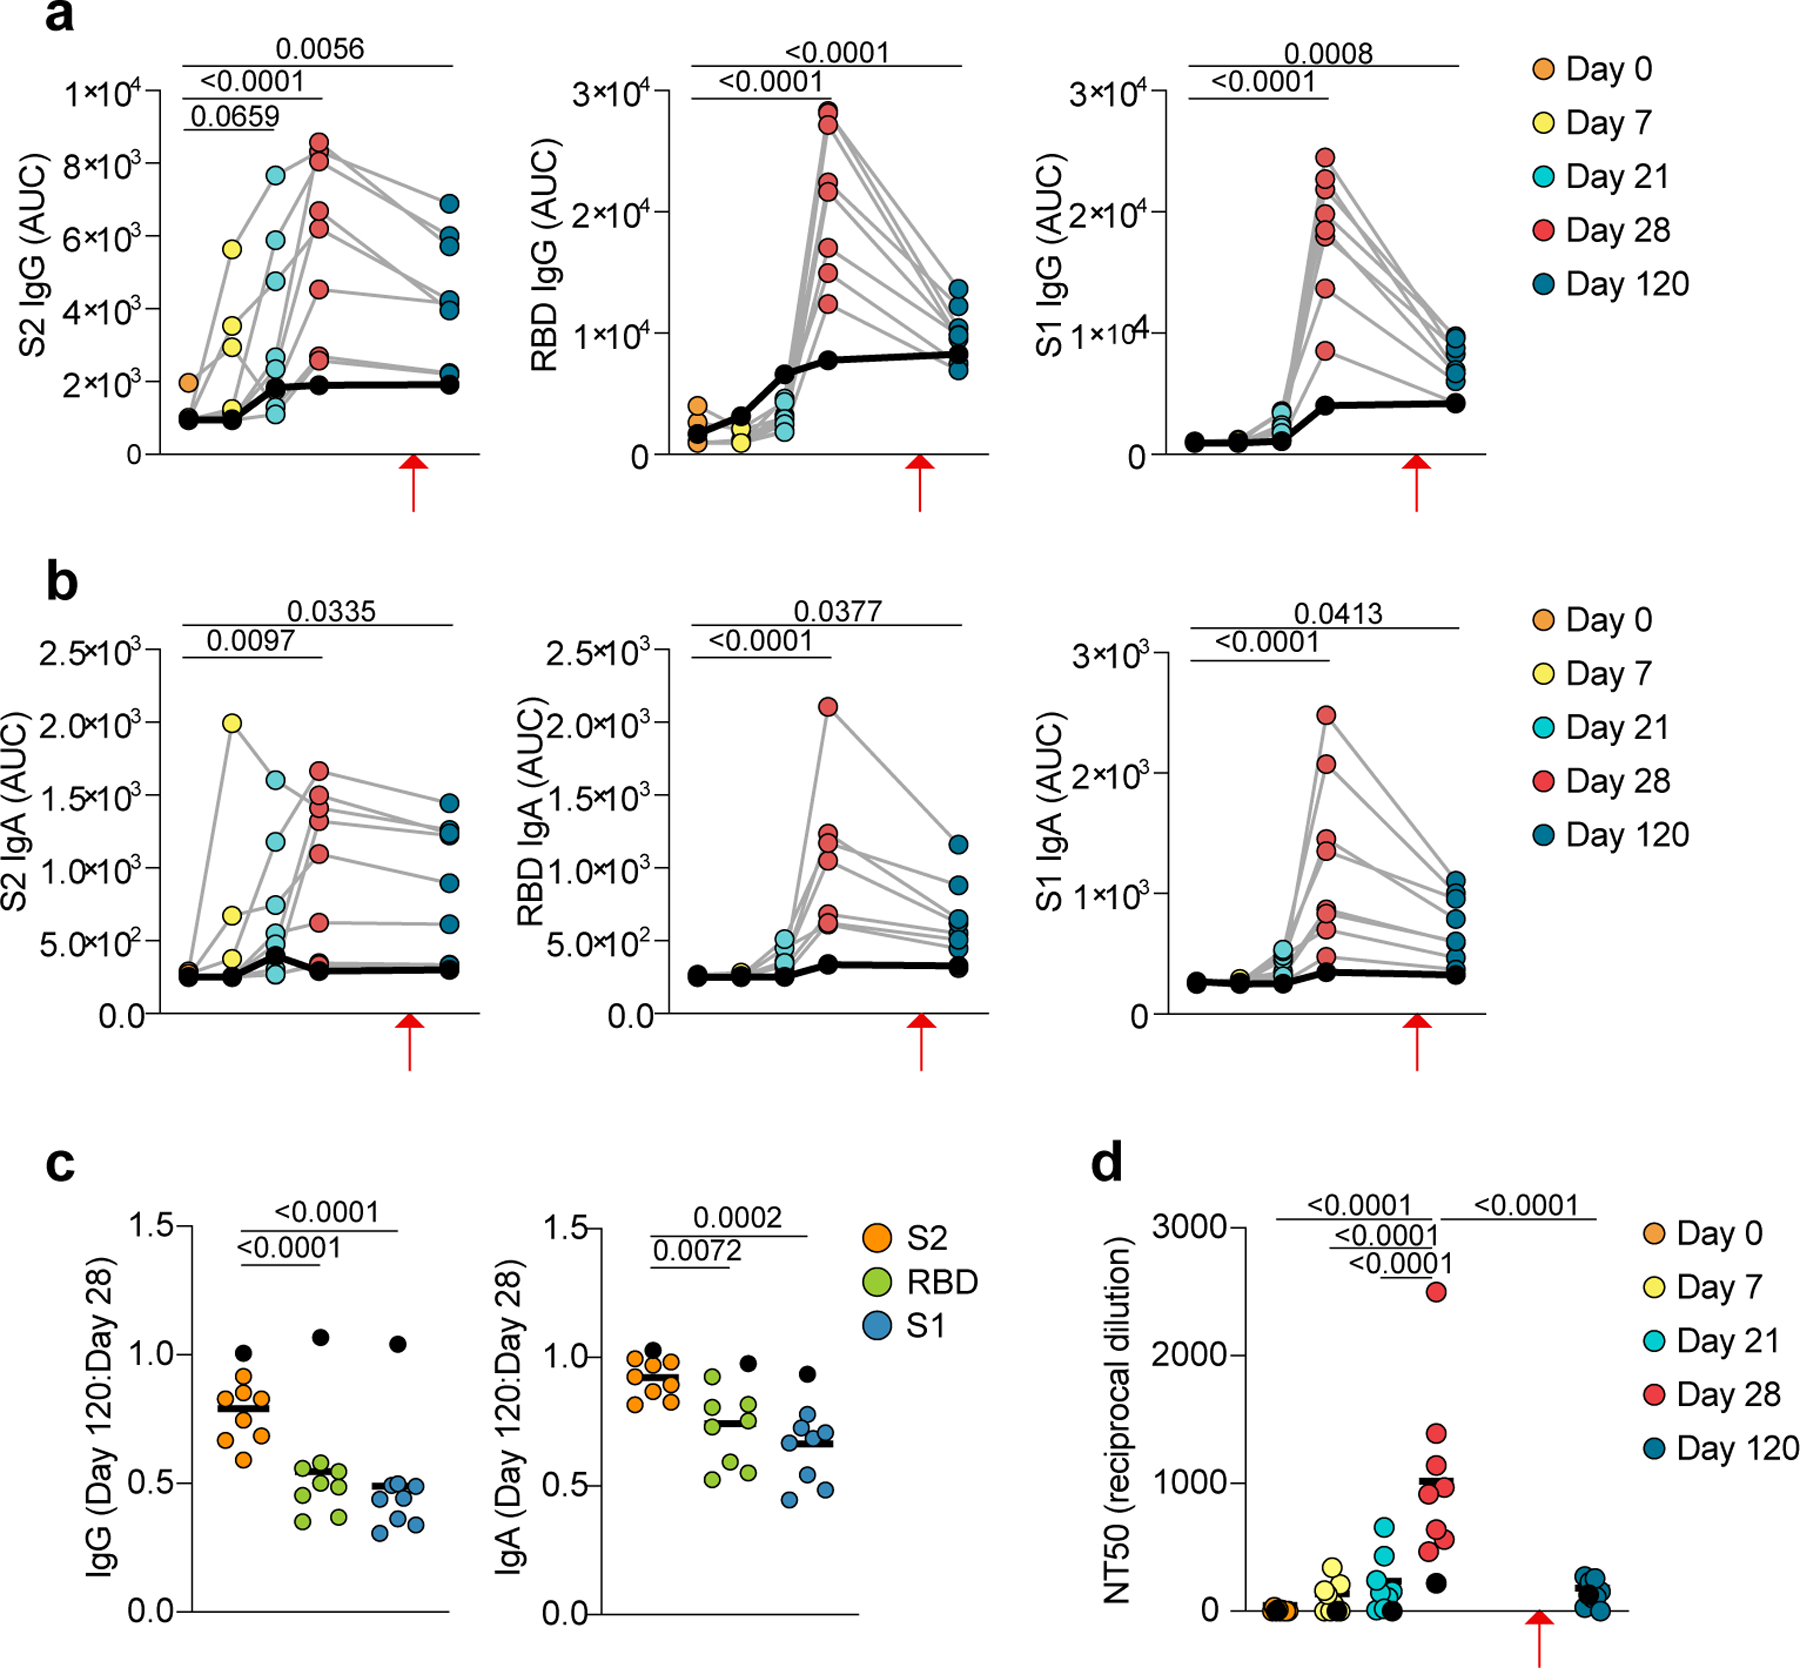
Extended Data Fig. 6. Plasma reactivity to S protein subunits.

a-c, ELISA data showing plasma reactivity against S-antigen subunits. a, IgG and b, IgA levels against S2 (left), RBD (center) and S1 (right). Area under the curve (AUC) of plasma dilutions is shown for n=9 participants at five timepoints. c, Ratio of IgG titers (left) and IgA titers (right) of day 120 AUC to day 28 AUC for S2, RBD, and S1. d, Plasma neutralization of SARS-CoV-2 pseudovirus. Quantification (NT50) of neutralization titers is shown for n=9 participants at five timepoints. Individual data points represent single B cells from n=9 individuals. a, b, individual values are shown. c,d, Individual values and medians are shown. a-d, Exact p-values according to two-tailed one-way ANOVA, followed by Dunnett’s multiple comparison test. P1 contracted COVID-19 at day 105, eight weeks after the second vaccination dose and two weeks before day 120 (red arrows). P1 is denoted by black dots and black lines. P1 is excluded from statistics in (c).
