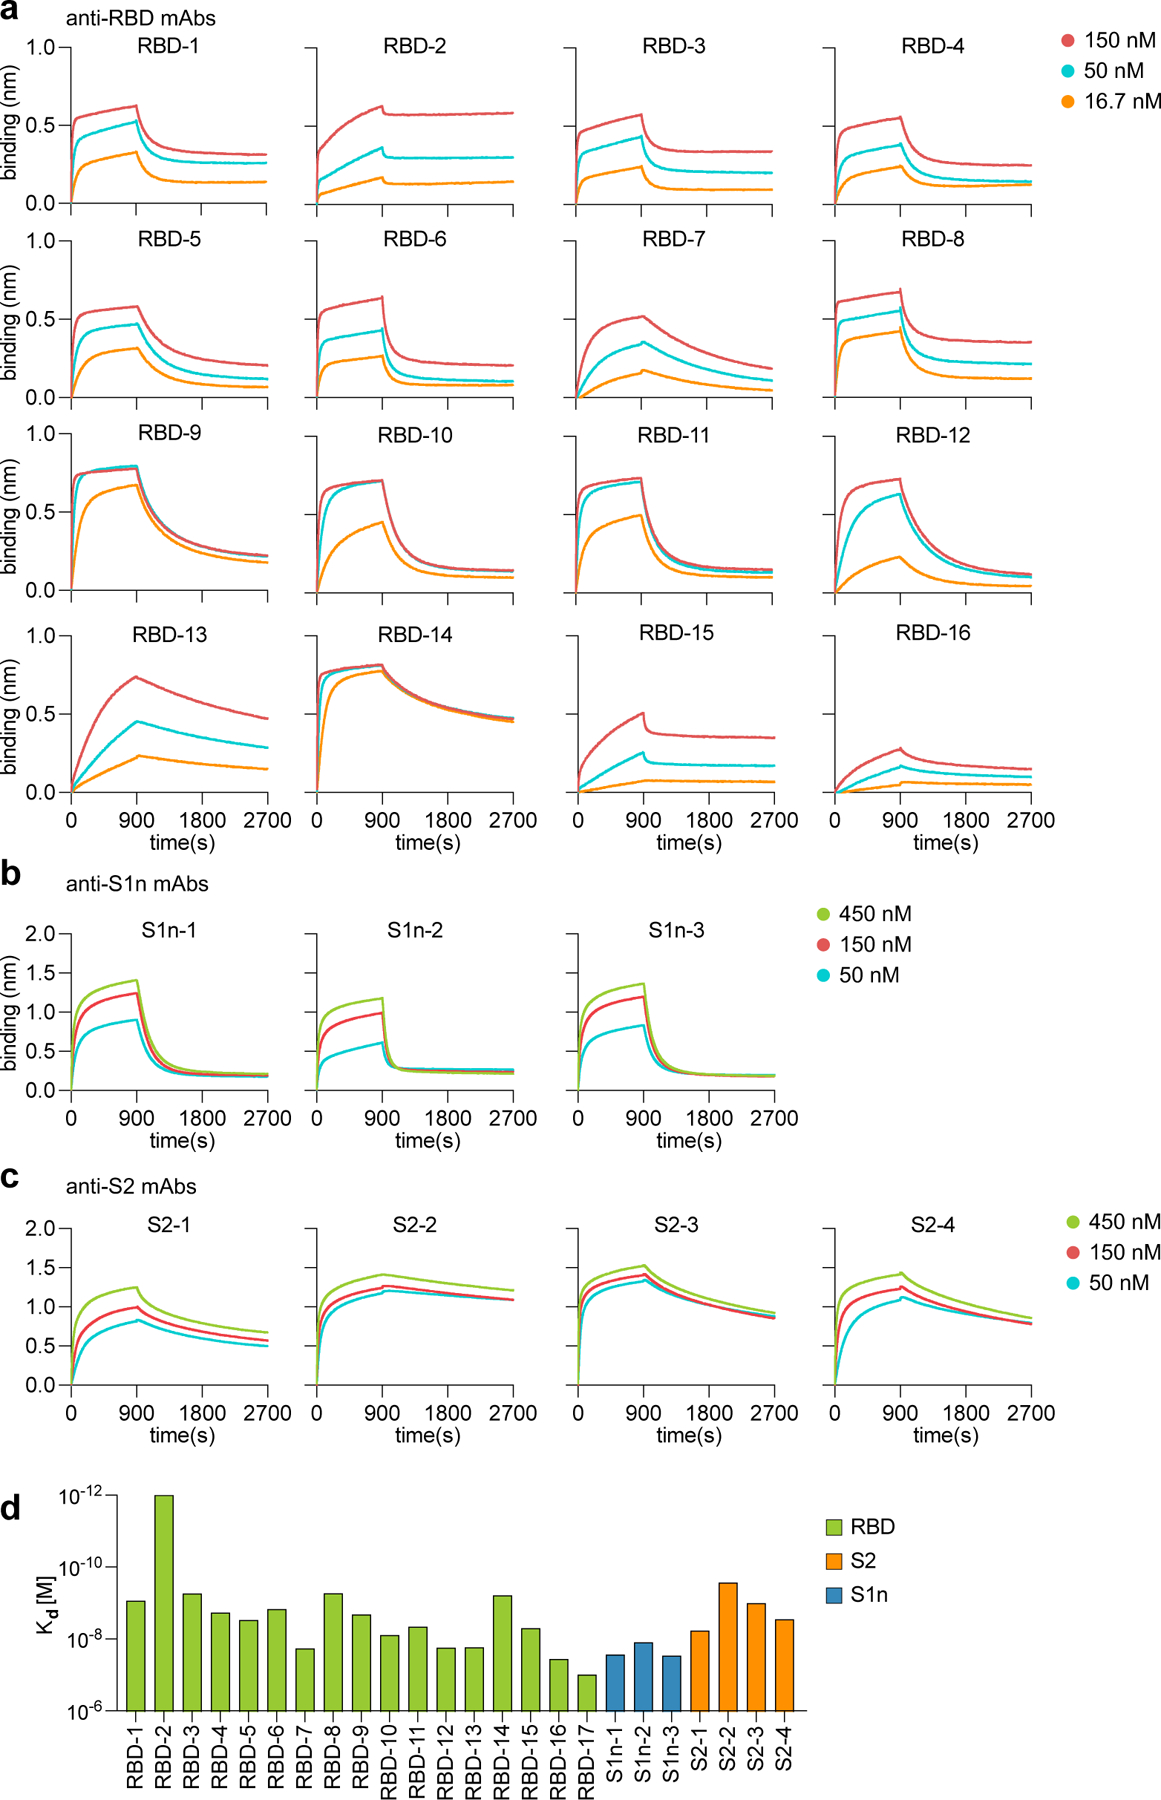
Extended Data Fig. 8. Binding affinities of RBD-, S1n-, and S2-pecific mAbs.

a-d, Bio-layer interferometry data showing mAb-antigen interaction affinities for a, RBD, b, S1n, and c, S2. Binding curves are shown for the indicated concentrations of antigen. d, Kd values of antibodies calculated from the binding curves shown in (a-c).
