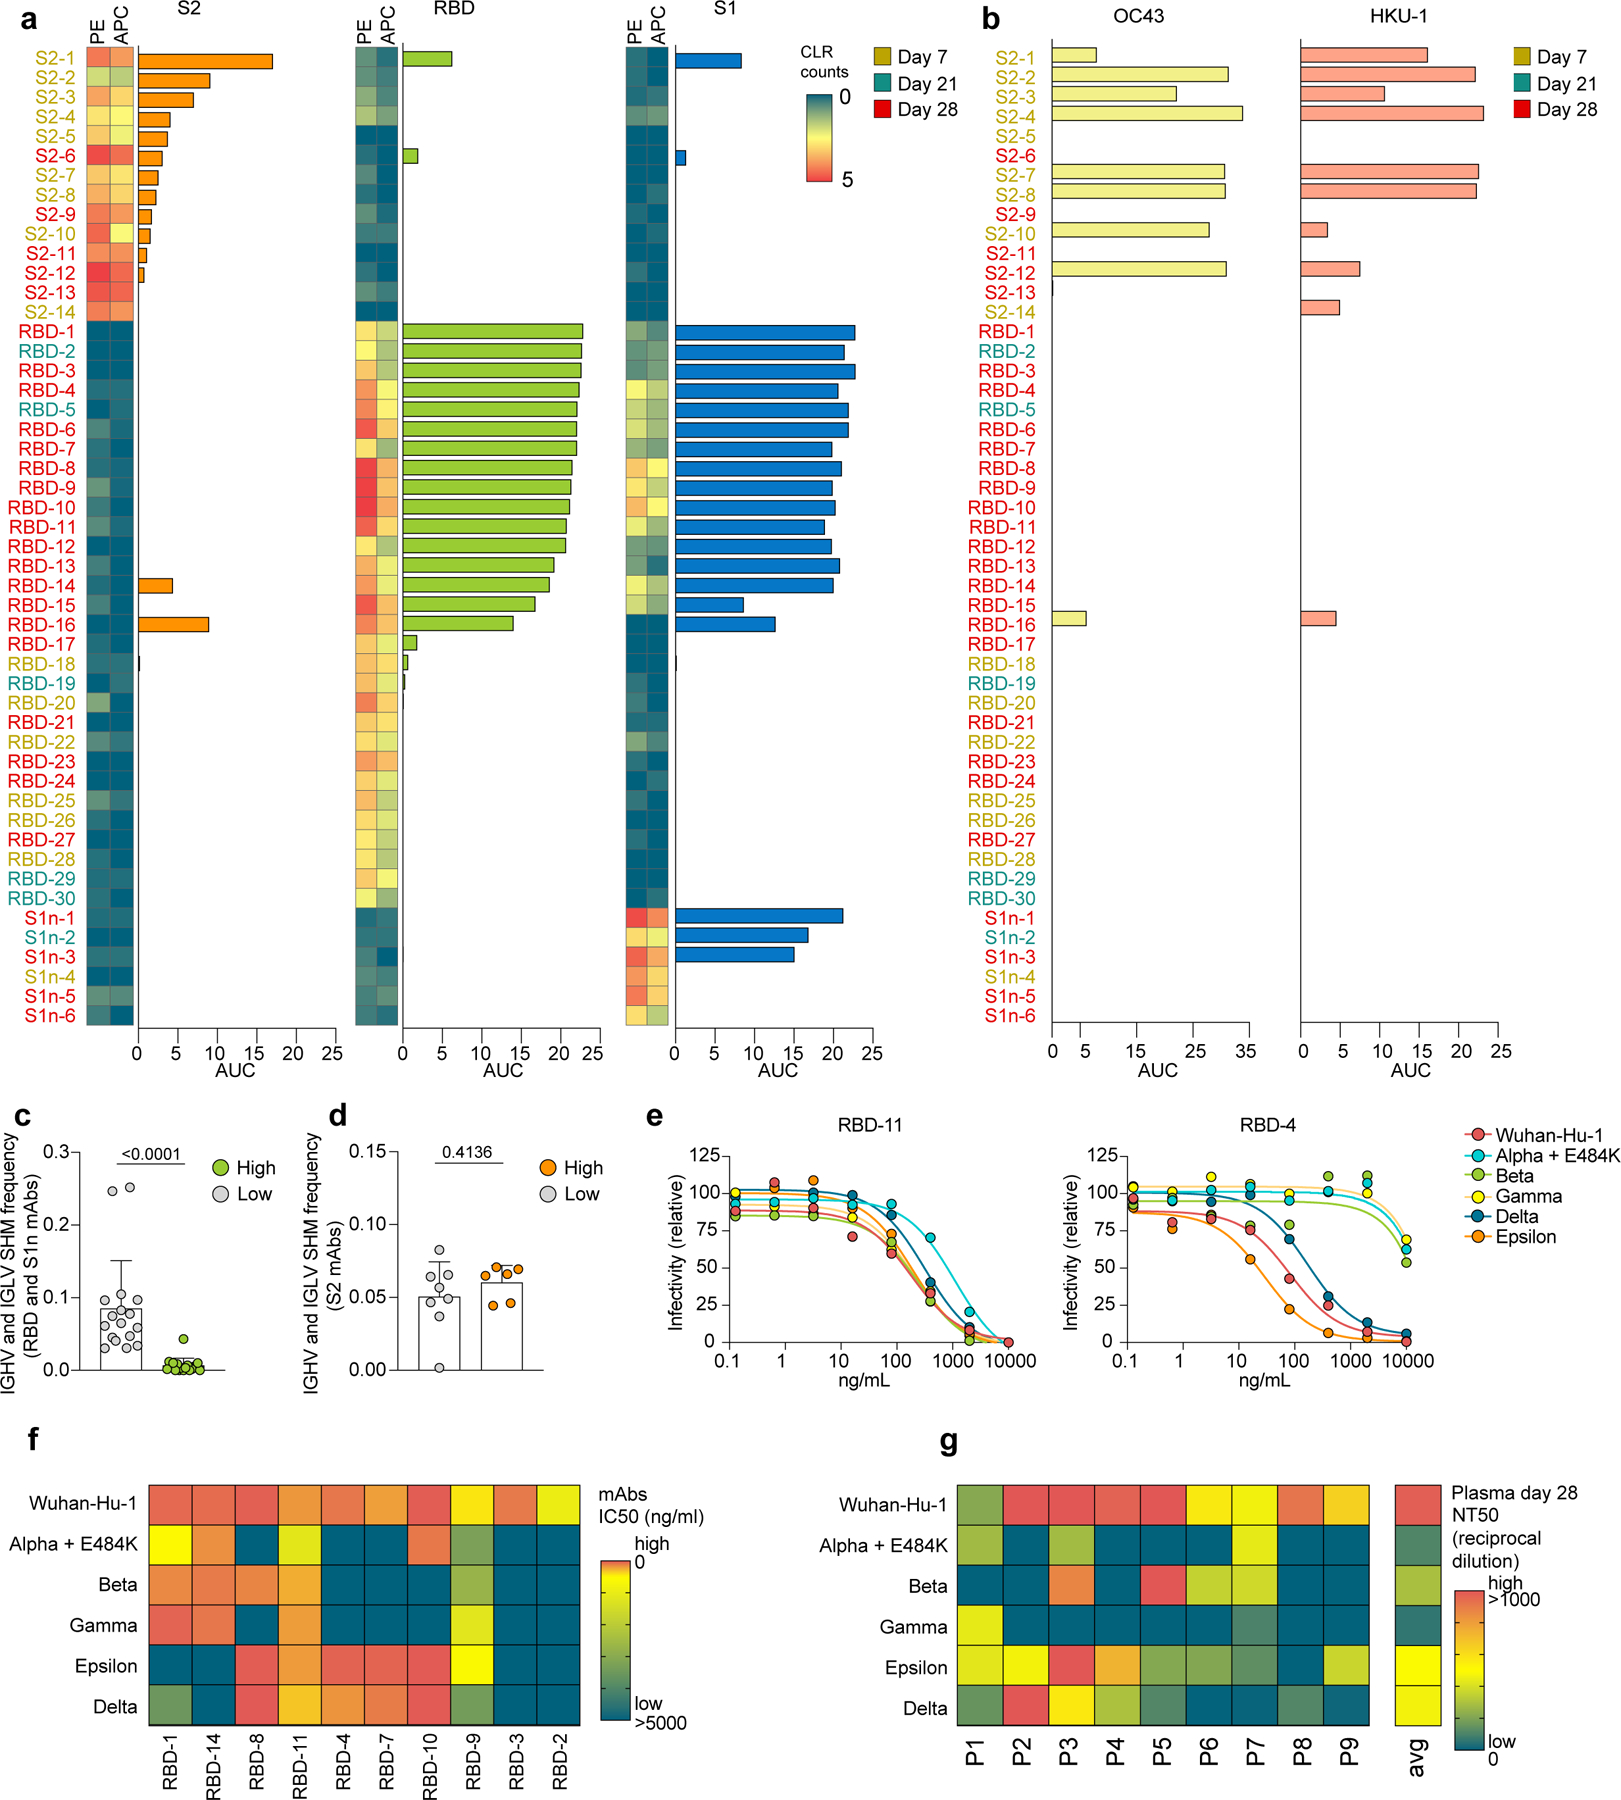
Fig. 4: Neutralization of SARS-CoV-2 pseudovirus and variants by BNT162b2-induced antibodies.

a-b, Single-cell sequencing data indicating abundance of barcoded and fluorochrome-tagged antigen-tetramers for each sorted B cell (two-column heatmaps, one barcode corresponding to PE and APC, respectively), paired with ELISA data of the corresponding expressed mAbs (bar graphs). Reactivity against S2, RBD, and S1, are shown. Barcoded tetramer binding data are represented as centered log ratio transformed (CLR) counts. b, ELISA data showing reactivity of the same mAbs as (a) against OC43 and HKU1 spike. a,b, ELISA data are shown as area under the curve (AUC) of plasma dilutions. Threshold at 0 was set to the average binding to bovine serum albumin (BSA) plus its three-fold standard deviation. c,d, Single-cell BCR repertoire sequencing data showing IGHV and IGLV SHM frequencies of c, RBD- and S1-specific B cells (high, n=17 cells; low, n=18 cells), and d, S2-specific B cells (high, n=8 cells; low, n=6 cells). High binding mAbs are defined by the data shown in (a) as positive for both PE and APC barcode tetramer binding and ELISA AUC >3. Individual values, means and standard deviations are shown, exact p-values according to unpaired two-tailed t-test. e-g, Neutralization of SARS-CoV-2 pseudovirus Wuhan-Hu-1 and variants alpha-epsilon are shown e, as dilution curves for antibodies RBD-11 (left) and RBD-4 (right) and f-g, as heatmaps indicating f, IC50 (ng/ml) for each mAb and g, NT50 (reciprocal dilution) of day 28 plasma for each of the n=9 participants. Immunoglobulin heavy-V gene (IGHV), immunoglobulin light-V gene (IGLV), somatic hypermutation (SHM).
