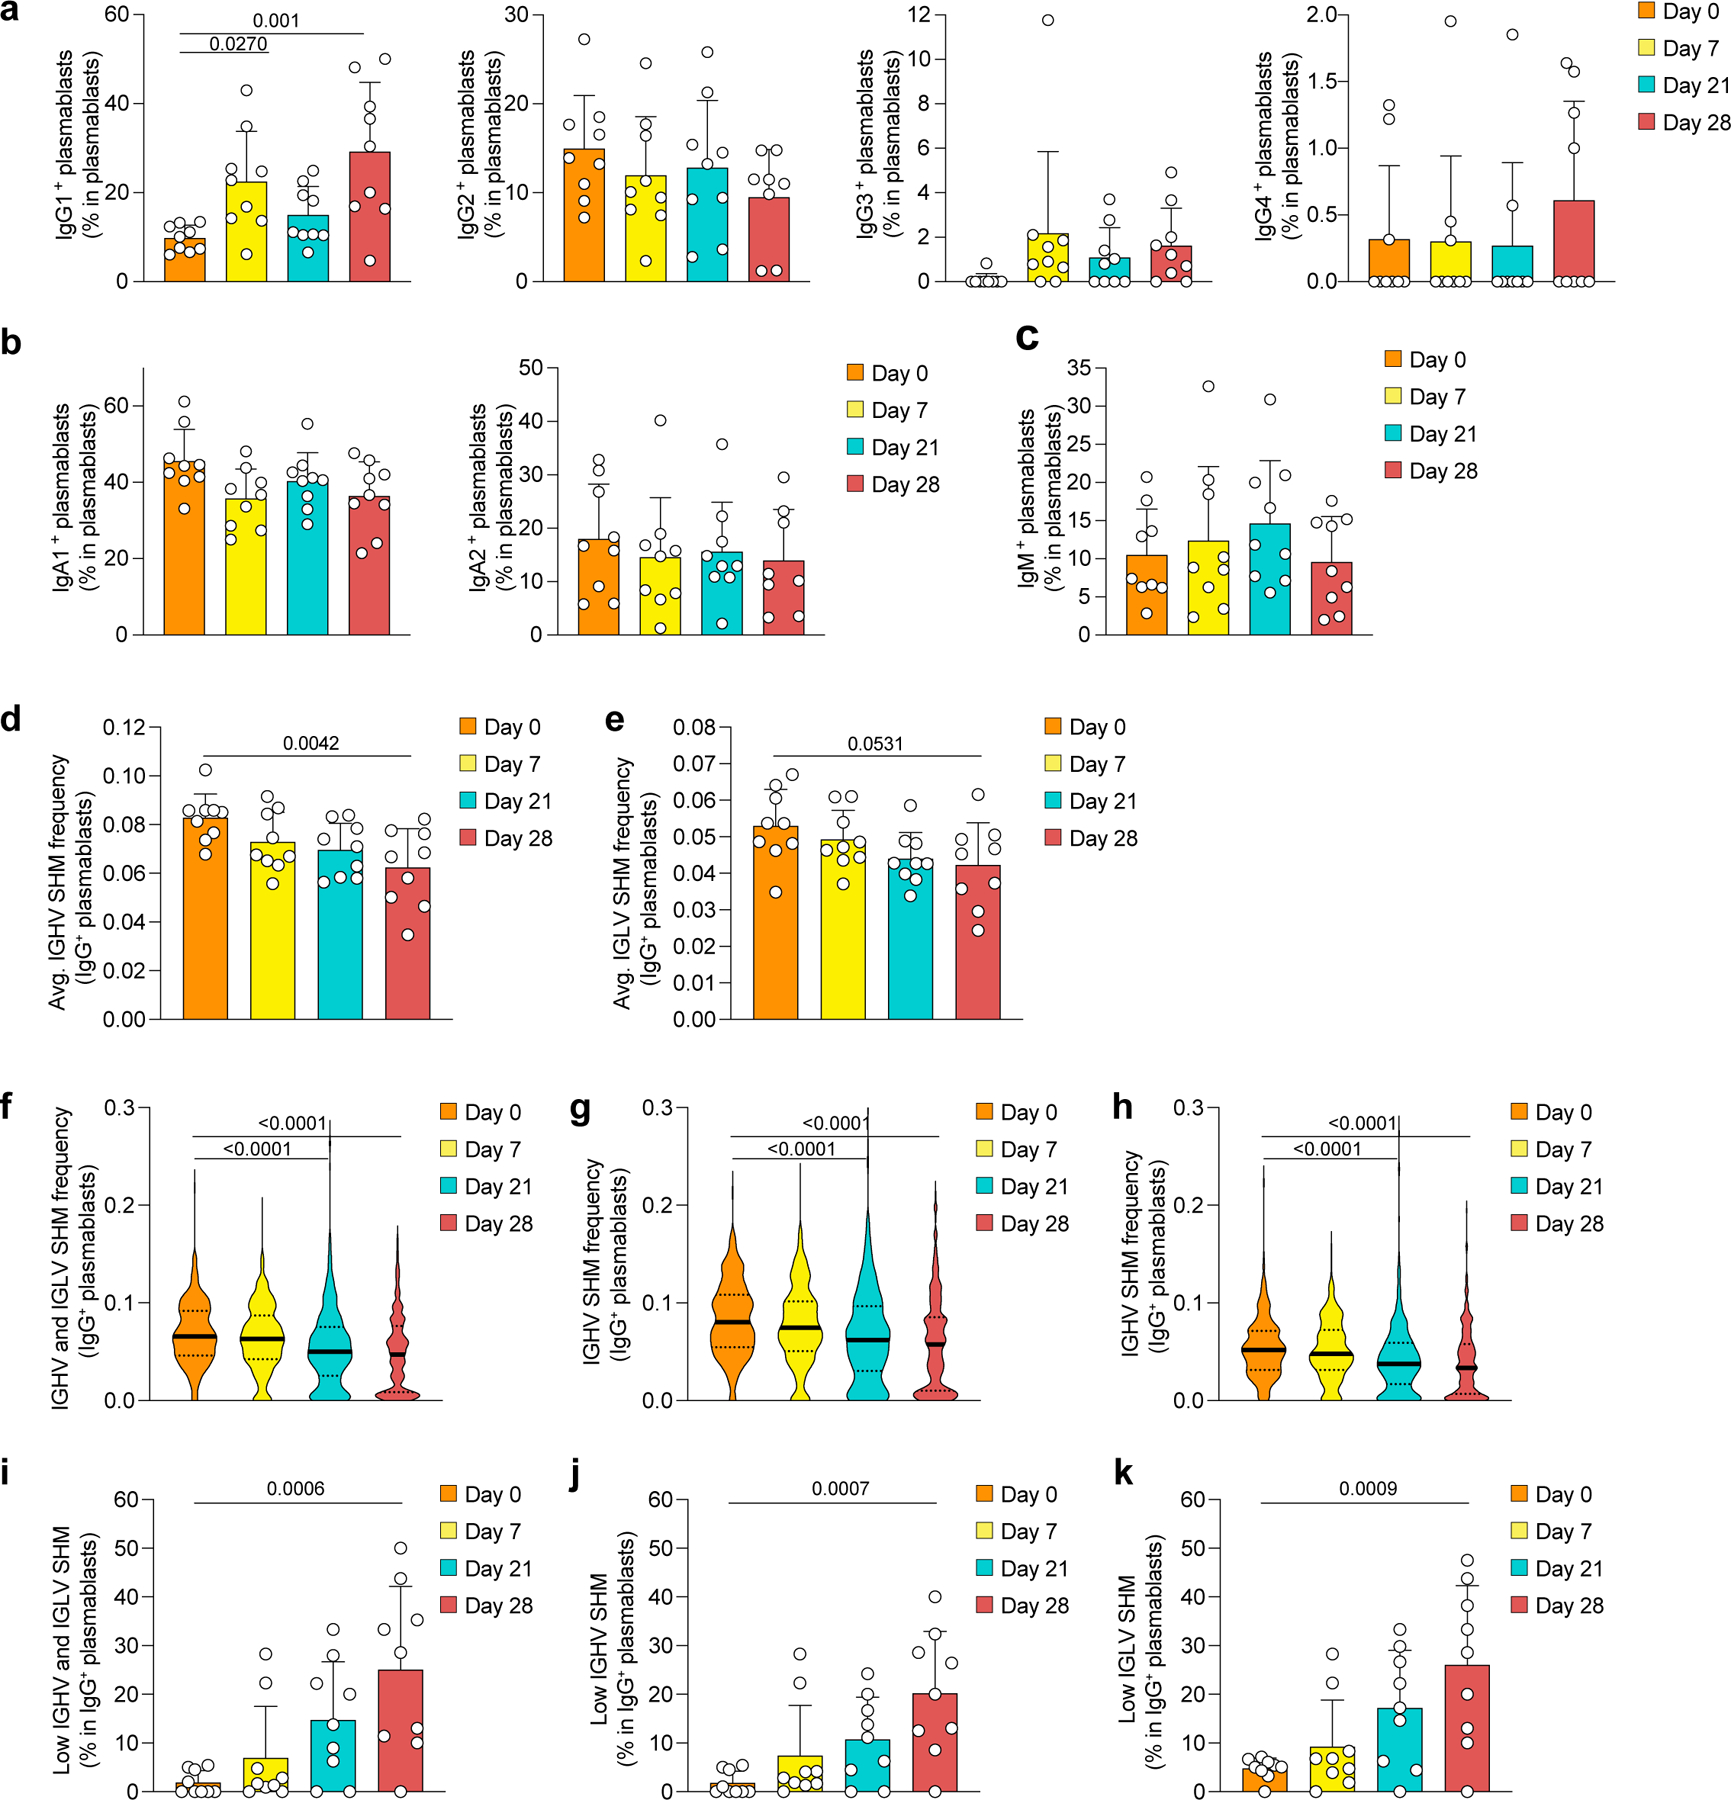
Extended Data Fig. 3. Plasmablast characteristics in response to mRNA vaccination.

a-k, Single-cell transcriptome and BCR repertoire sequencing data of the global (non-sorted) B cell dataset showing proportions of a, IgG subclasses, b, IgA subclasses and c, IgM in total plasmablasts in n=9 participants. d,e, Average SHM frequency in IgG+ plasmablasts for d, IGHV and e, IGLV in n=9 participants. f-h, Distribution of SHM frequencies in single plasmablasts from all n=9 individuals, separated by f, IGHV and IGLV, g, IGHV, and h, IGLV. i-k, Proportion of low SHM frequency (≤ 0.01) IgG+ plasmablasts in all plasmablasts, separated by i, IGHV and IGLV, j, IGHV and k, IGLV for n=9 individuals. a-e, i-k, Individual values, means, and standard deviations are shown. f-h, Violin plots with medians and interquartile ranges are shown. Exact p-values according to a-e, i-k, two-tailed one-way ANOVA, followed by Dunnett’s multiple comparison test, and f-h, Kruskal-Wallis test followed by Dunnett’s multiple comparison test. Immunoglobulin heavy-V gene (IGHV), immunoglobulin light-V gene (IGLV), somatic hypermutation (SHM).
