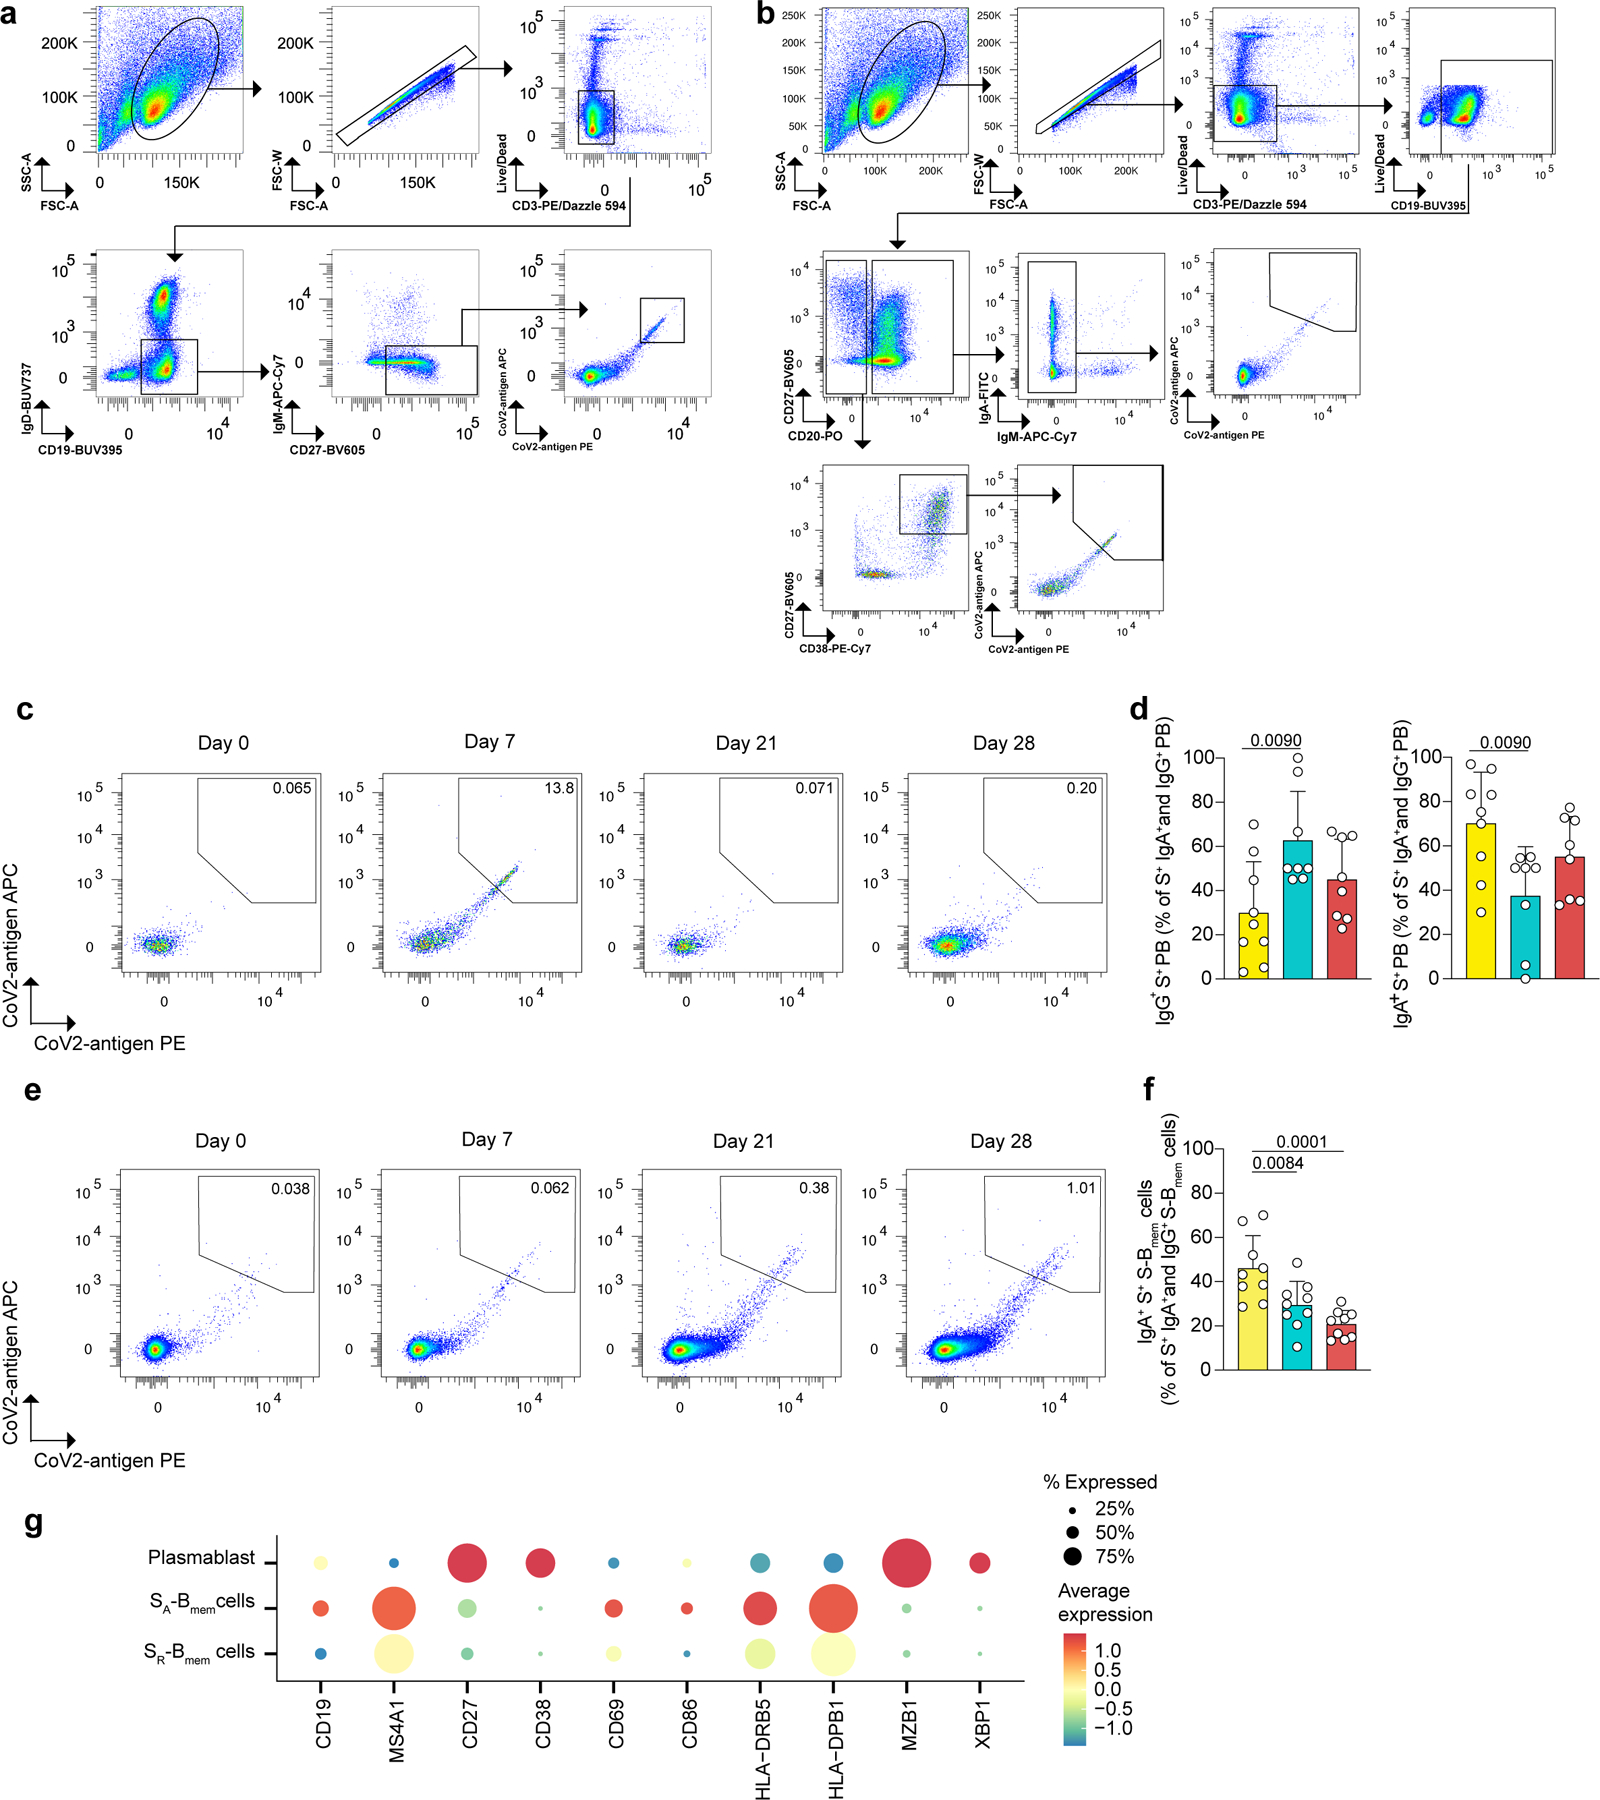
Extended Data Fig. 4. Characterization of tetramer-sorted S-antigen-specific switched BMem and plasmablasts.

a-f, Flow cytometry data showing a, the gating strategy for cell sorting of live singlet S-Bmem cells and plasmablasts based on marker expression: CD3-, CD19+, IgD-, IgM-, CD27+. Cells were stained with two antigen-tetramers (PE labeled and APC labeled) for each subunit of S (S1, S2, and RBD), respectively. Tetramer-double-positive cells were sorted and tetramer-double-negative cells were sorted as controls. b, Gating strategy for flow cytometry analysis of S-Bmem cells and plasmablasts. c, Representative flow cytometry analyses showing two-dimensional antigen-tetramer staining of S-specific plasmablasts. d, Proportion of IgG+ (left) and IgA+ (right) S-specific plasmablasts in all IgG+ and IgA+ S-specific plasmablasts at the indicated timepoints post vaccination. e, Representative flow cytometry analyses showing two-dimensional antigen-tetramer staining of S-specific S-Bmem cells. f, Proportion of IgA+ S-specific S-Bmem cells in IgG+ and IgA+ S-specific S-Bmem cells at the indicated timepoints post vaccination. g, Single cell transcriptome sequencing data showing marker genes characteristic for the respective clusters shown in (Fig. 3d). d, f, individual values, means, and standard deviations are shown for n=9 participants. Exact p-values according to two-tailed one-way ANOVA, followed by Dunnett’s multiple comparison test. Memory B cells (Bmem cells), switched memory B cells (S-Bmem cells), plasmablasts (PB), S-specific (S+).
